

Using Machine Learning to identify operational modes in rotating equipment
Vibration monitoring is key to performing condition monitoring-based maintenance in rotating equipment such as engines, compressors, turbines, pumps, generators, blowers, and gearboxes. However, periodic route-based vibration monitoring programs are not enough to prevent breakdowns, as they normally offer a narrower view of the machines’ conditions.
Adding Machine Learning algorithms to this process makes it scalable, as it allows the analysis of historic data from equipment. One of the benefits is being able to identify operational modes and help maintenance teams to understand if the machine is operating in normal or abnormal conditions.
But first, what is an operational mode?
In a pump, for example, different operational modes could reflect different usages in a production process (different fluids to be pumped), an on-off state, or a developing failure. Often, these operational modes are reflected in the historic vibration data, showing up as time periods in which the data exhibits a similar structure.
Now imagine having to look at a year-long time series of vibration measurements and trying correlate them with different operating modes. It would be an extremely daunting and time-consuming task. MultiViz Vibration eases this process by automatically detecting operational modes in a scalable way for a large number of assets.
This is achieved by an algorithm, called Automatic Mode Identification (AMI), a generic algorithm for multivariate time series. It is an unsupervised algorithm, which means that no ground truth or annotations by experts are necessary. It performs multidimensional time series data segmentation and clustering, with clusters being optimized to reduce quick oscillations and model complexity to avoid over or underfitting.
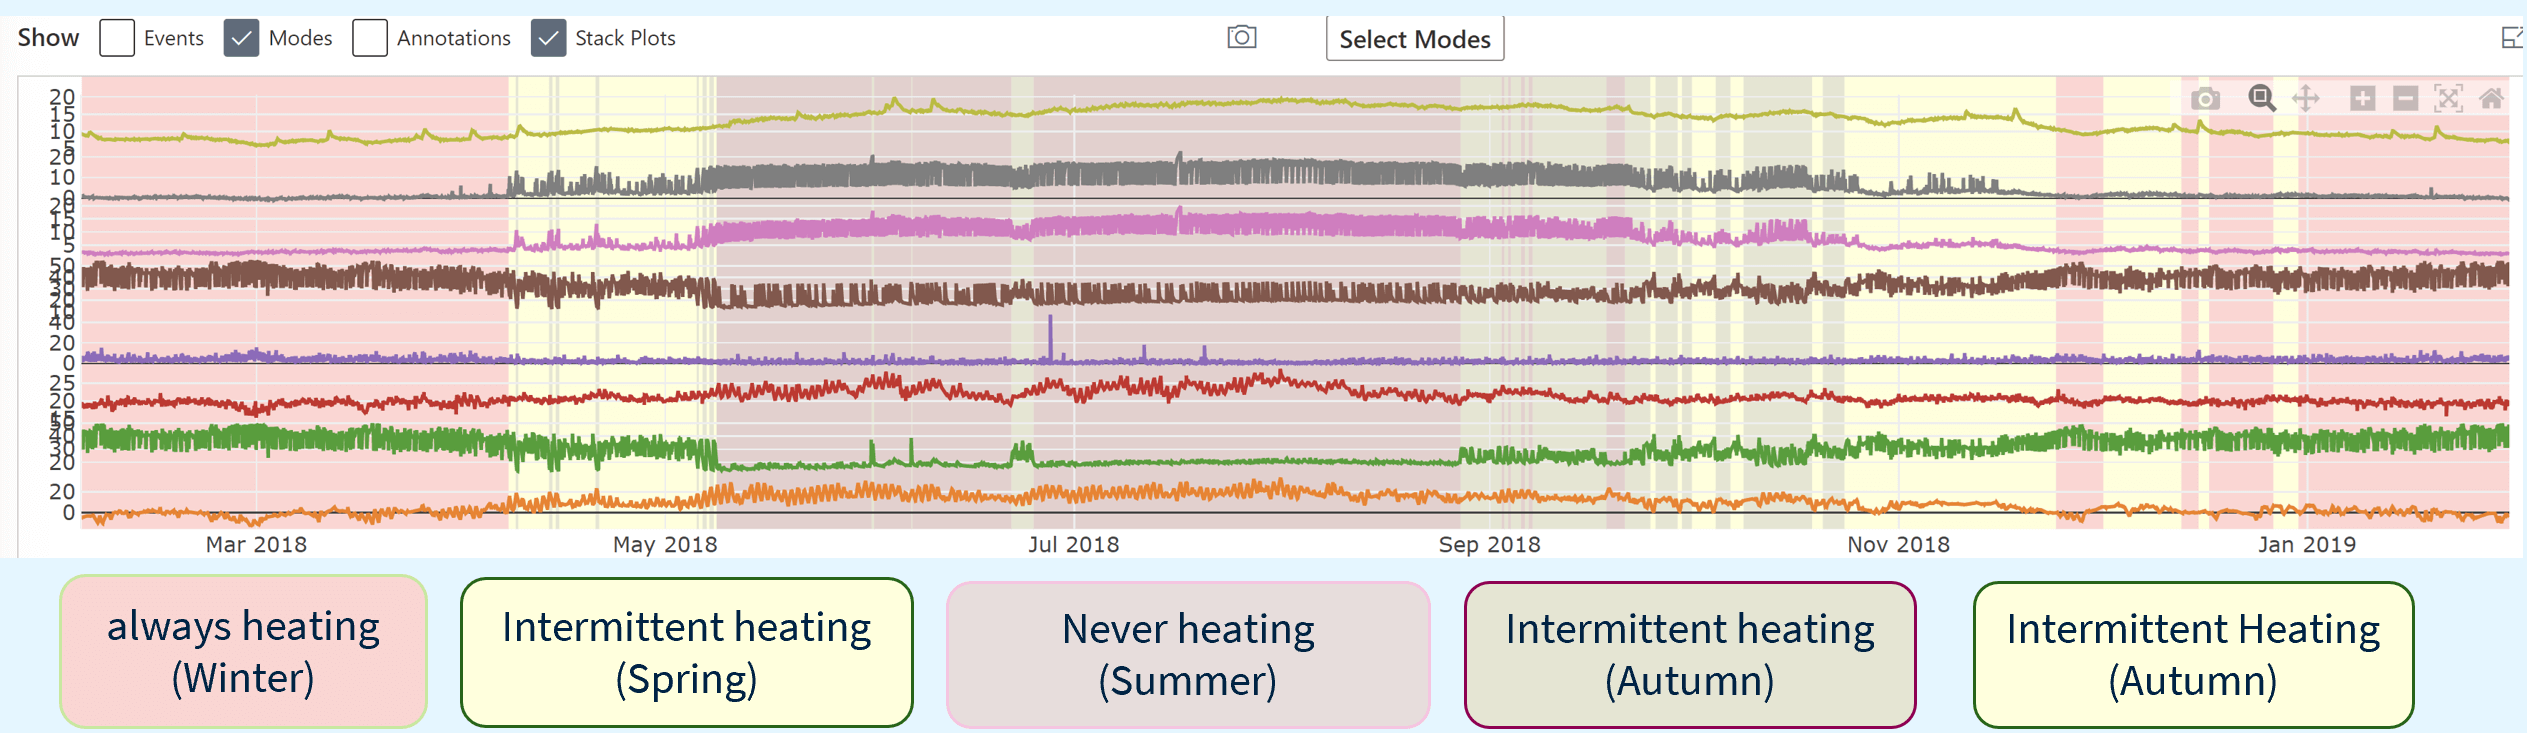
The example below shows the application of AMI to one year of data from a heat pump. The unsupervised algorithm correctly detected four modes which can be easily mapped onto the operational modes with actual relevance:
- Never heating: occurs during summer, when no heating is required.
- Always heating: occurs during winter, when the heat pump works constantly.
- Intermittent heating: two modes for autumn and spring when the heat pump is heating, but not constantly.
Using AMI on vibration data
Given a time series on vibration measurements, the measurements need to be converted from the time domain into the frequency domain. AMI will then segment the frequency time series data into an optimal number of clusters representing the operational modes.
From our experience, the operational modes often correctly capture typical states of an asset, like on/off, different production settings or developing failures. Also, the number of modes identified can be very informative, as the emerging of a new, previously not seen mode, could point towards either the asset being used in a new way or a developing failure.
So, one simple condition monitoring routine could be to look at the modes of a machine and watch out for uncommon patterns, like the emergence of new modes. As the history of modes can be easily displayed in one graph over a long time-period for several equipment, mode identification allows to really scale up the efficiency of condition monitoring.
Using MultiViz Vibration
To perform automatic mode identification with MultiViz Vibration, the user simply needs to upload vibration time series data to the API and request an analysis of the data. The engine will internally convert the time domain data into the frequency domain and apply the AMI algorithm on the converted data. The result returned by the analysis contains the mode (label) automatically assigned to each timestamp, as well as a flag which indicated if the assigned label is uncertain, which could be an indication of an anomaly. The information is returned as a json structure, which makes it easy to use the results in a client application, e.g., for producing an overview plot showing modes over time.
{
    'timestamps': [... list of timestamps ...],
    'label': [... list labels (=mode numbers)...],
    'uncertain': [... list of booleans indicating uncertain modes]
}
MultiViz Vibration can be accessed either directly via a REST API or the va_mvg Python Package, allowing software developers or data scientists to integrate the results into an existing predictive maintenance solution or even create their own machine diagnostics service.

