
Understanding Modes: Smarter Grouping of Your Machine Data
Intro to Modes
When you're monitoring machines 24/7, it doesn’t take long before the amount of data becomes overwhelming. That’s where Modes come in — a core concept in MultiViz that helps you make sense of it all, fast.
Modes are automatically identified and are available in the Deep Analysis view. Instead of reviewing hundreds of individual measurements, Modes allow you to focus on a few representative patterns that summarize the machine’s behavior.
What Are Modes?
Modes are groups of measurements that share similar characteristics, particularly in how their spectra look in terms of peaks and energy distribution. This grouping allows you to get a clear picture of a machine's condition by looking at just a few examples.
Modes are visually distinguished by different background colors in the trend plot, making it easy to spot changes over time.
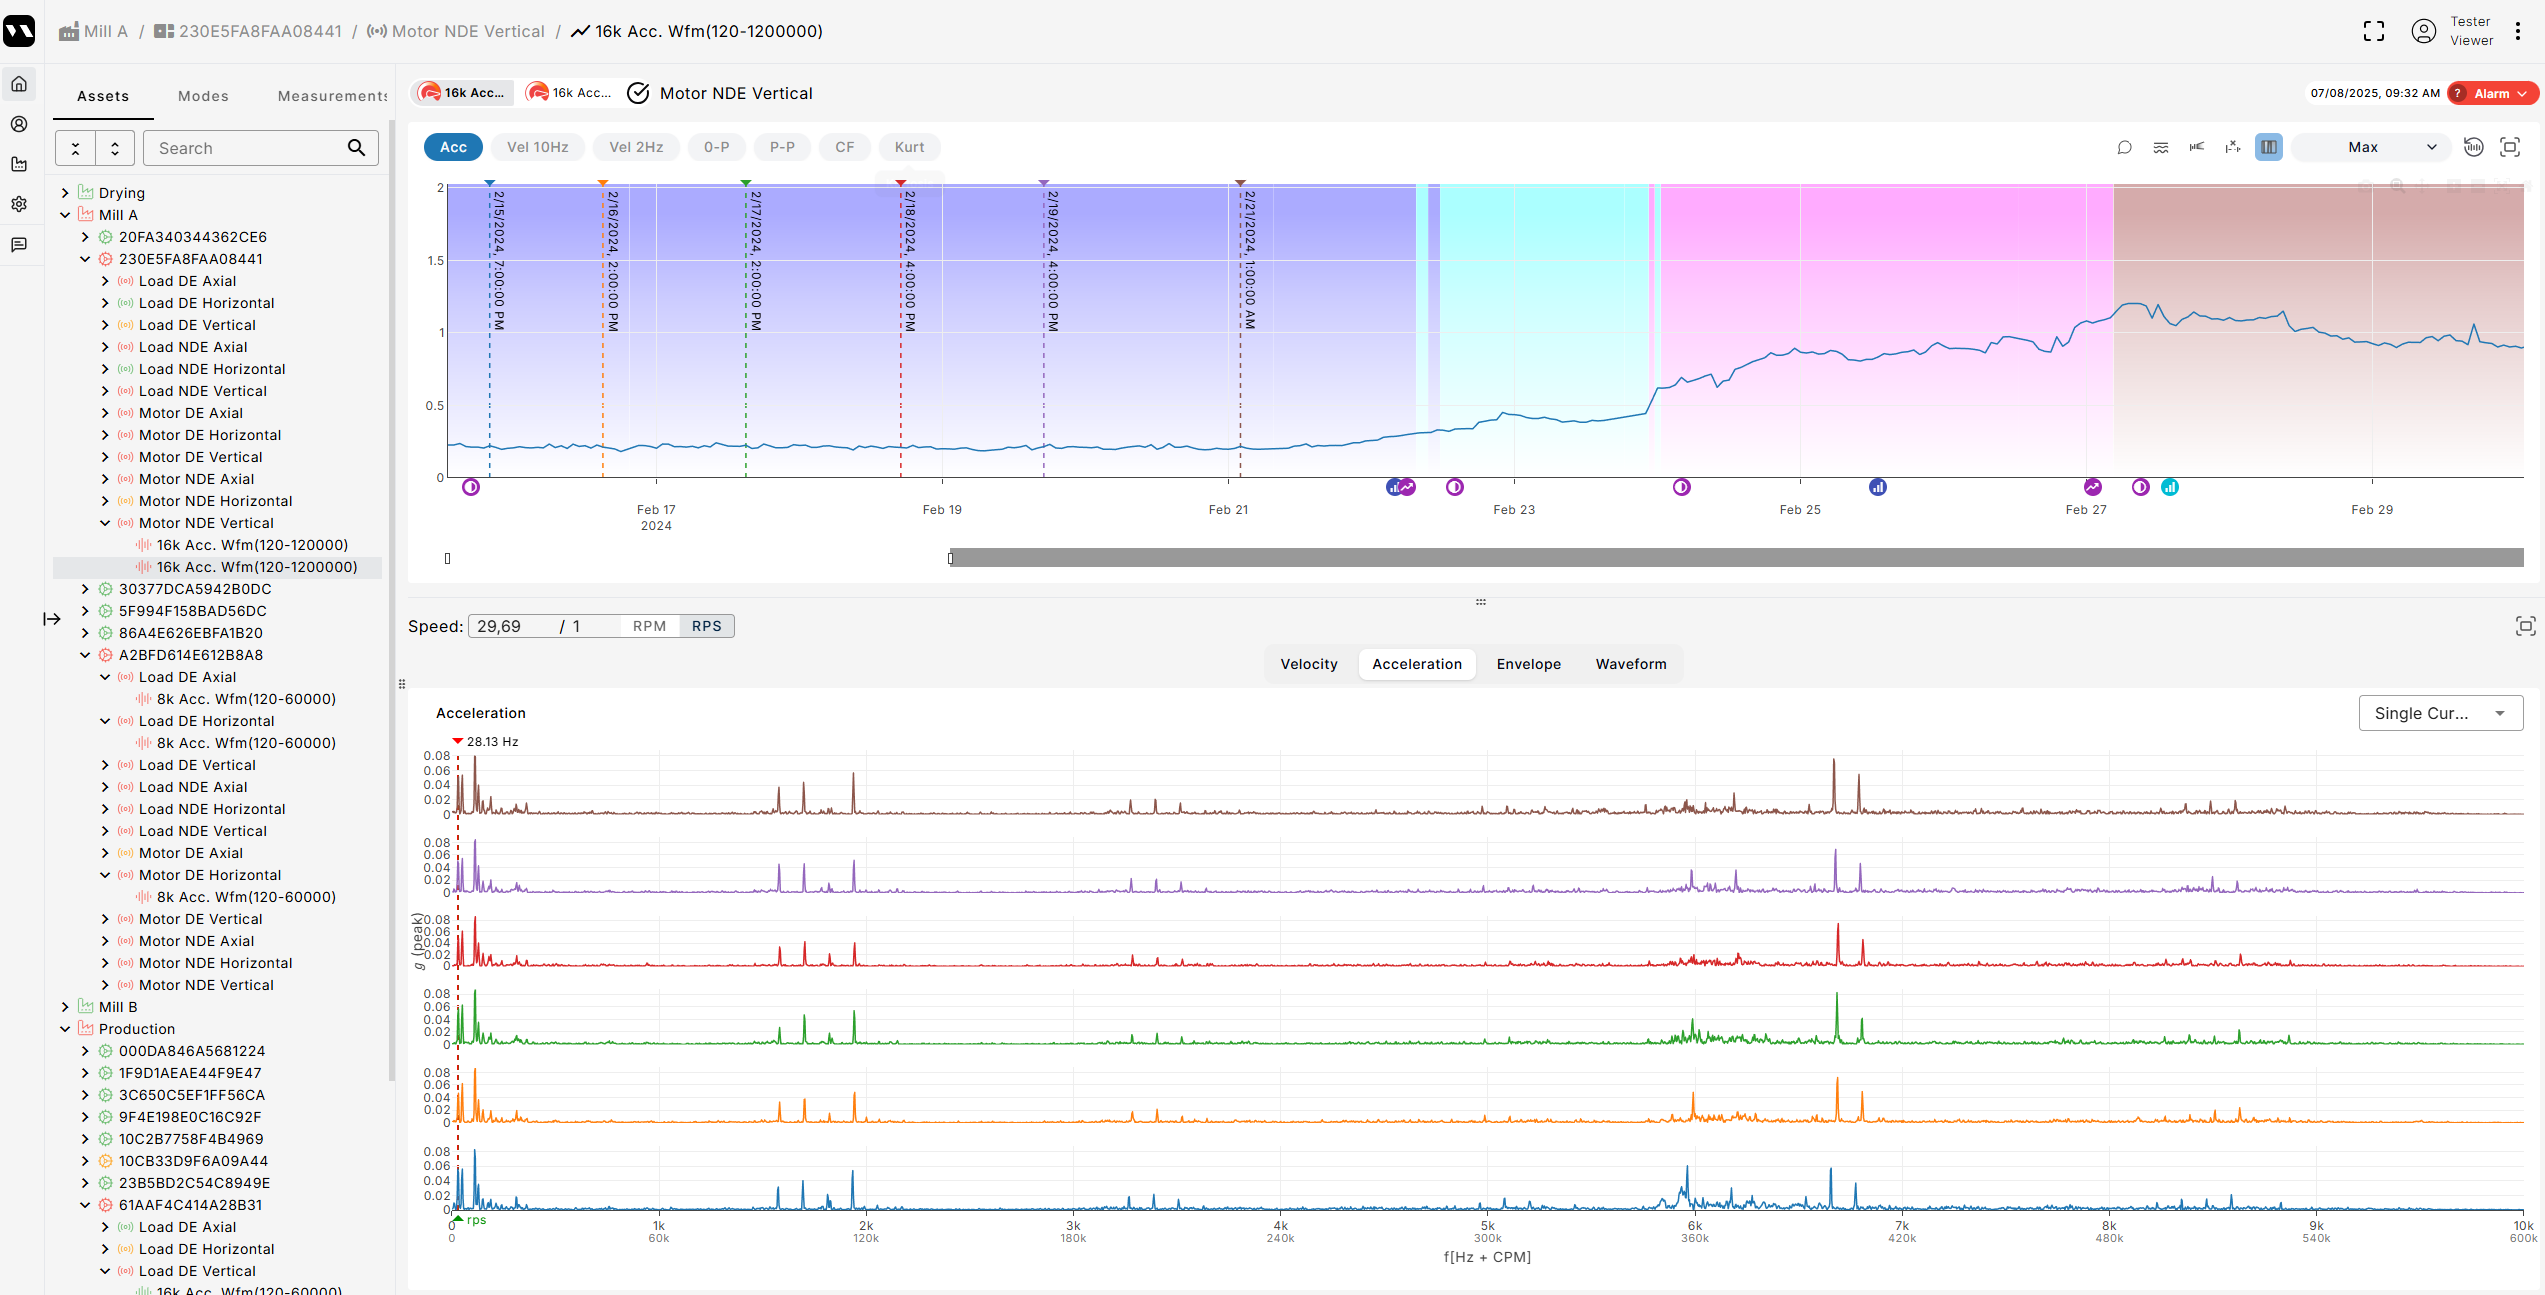
In the image below, you can see how 780 measurements are grouped into just 4 Modes (Purple, Light Blue, Pink and Brown). Rather than reviewing hundreds of data points, you only need to inspect one from each Mode to understand what’s going on.

Measurements within the same Mode are highly similar — which is what makes them so powerful. Here’s how that looks, all measurements we selected in the image below are part of the same mode, the purple one.
How Modes Evolve: High and Low Frequency Events
Modes aren’t static: even within a single mode, important shifts can occur over time, and MultiViz flags these changes with specific events that show exactly where in the frequency spectrum the shift is happening.
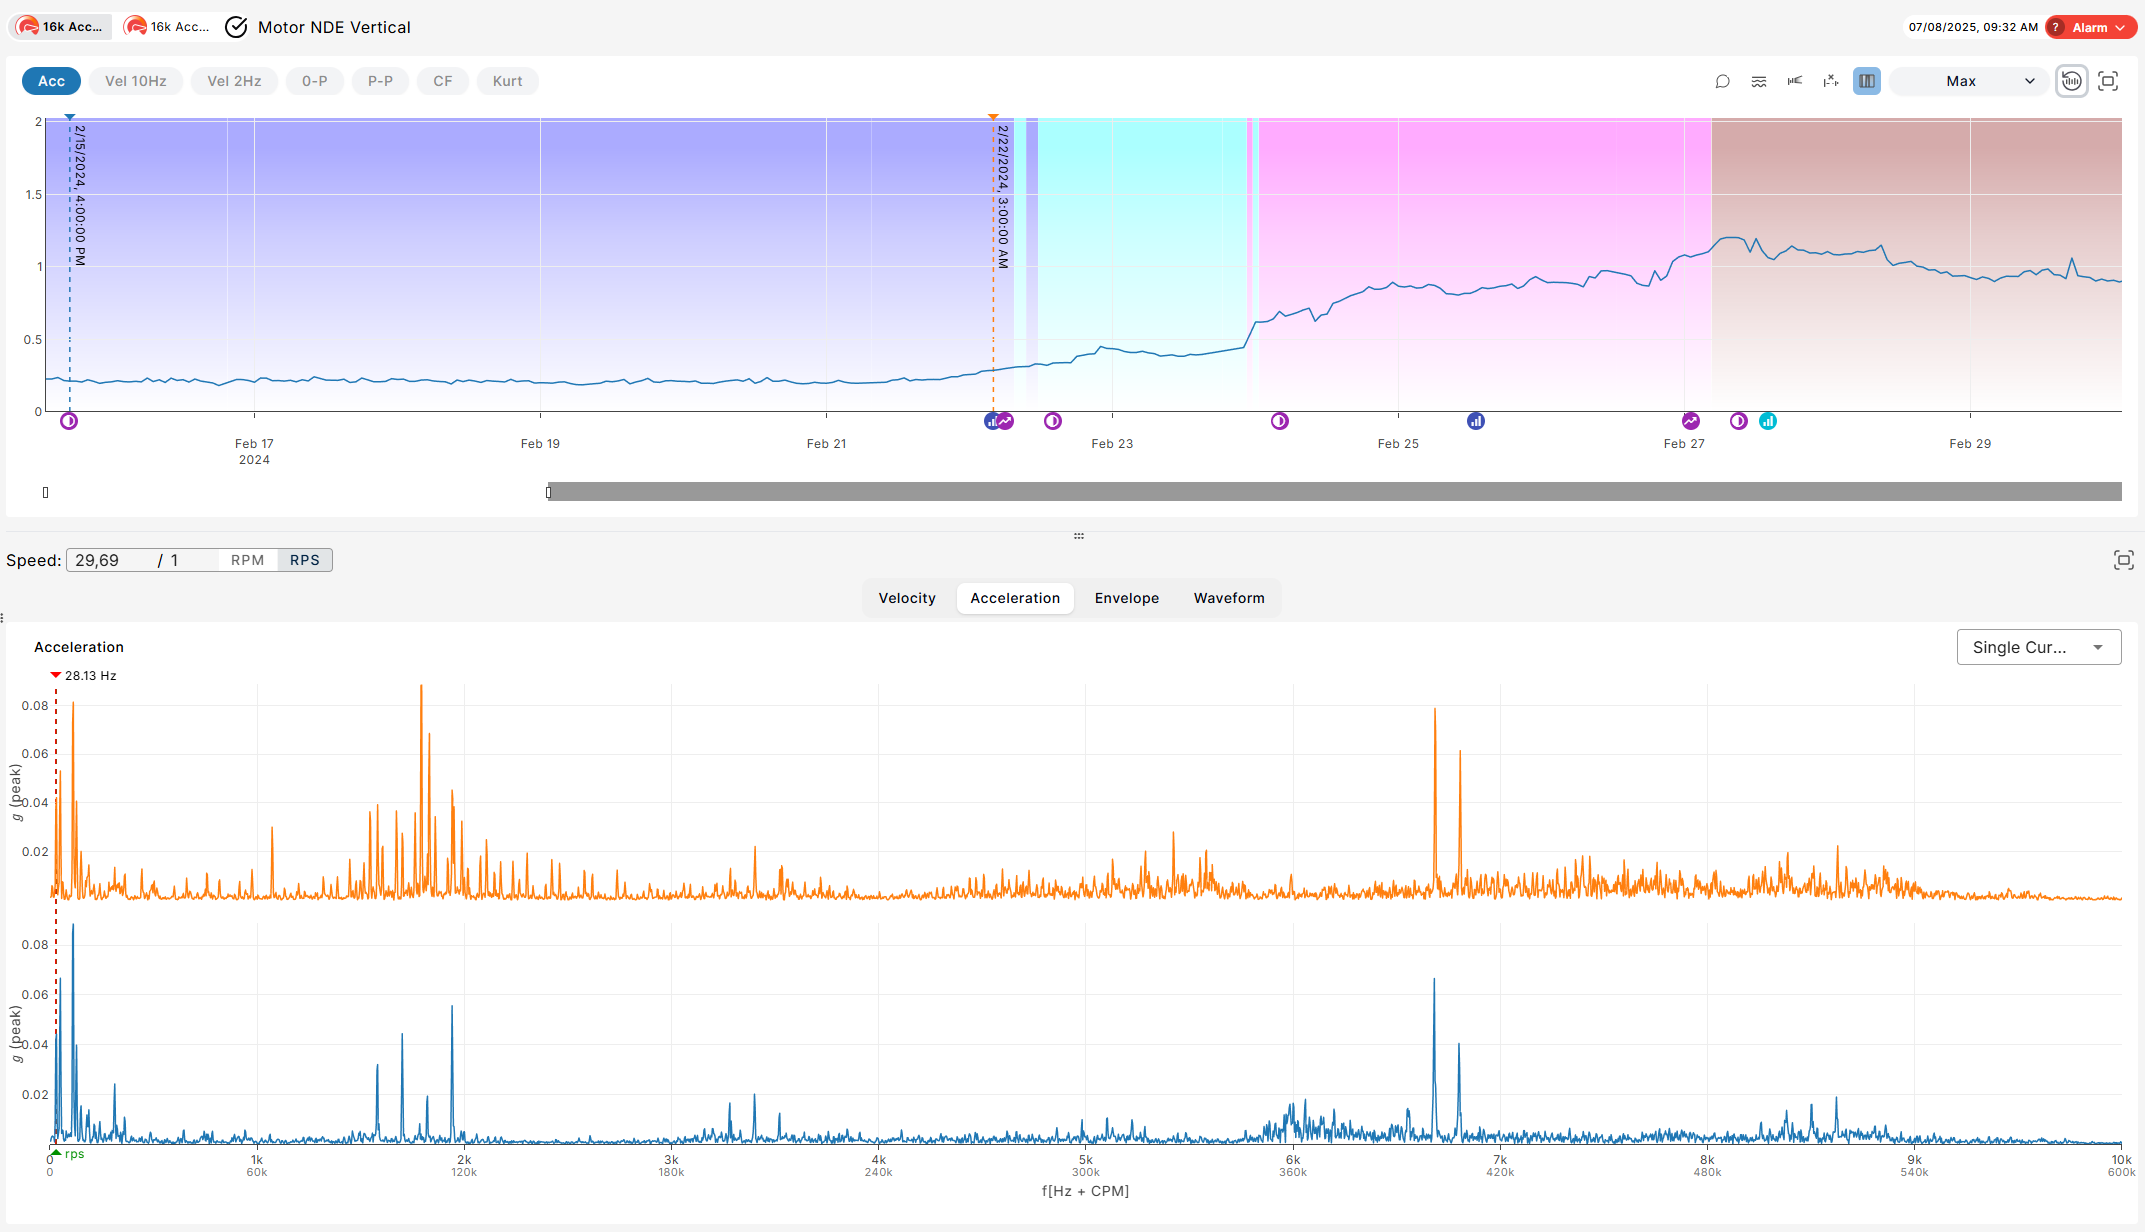
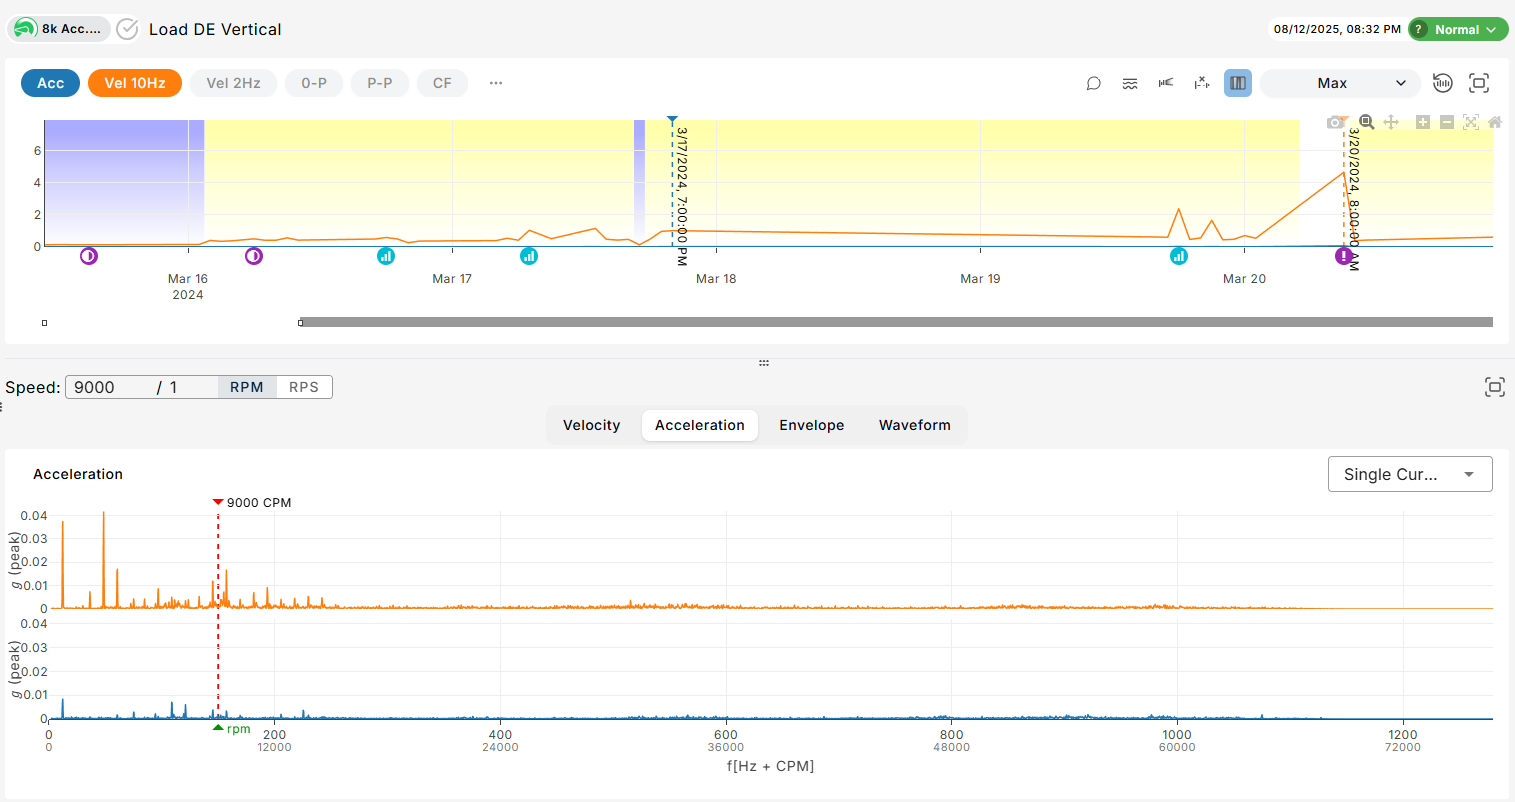
There are different types of events that highlight various kinds of changes. The image below is an example of a high-frequency event that occurred within a single mode:
High-Frequency Event
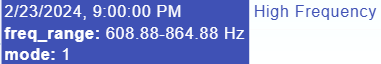
When a Mode’s energy increases in the higher part of the spectrum, a High-Frequency Event is generated:
By hovering on the icon of the event, you can see these cards, in which the system also highlights the region of the spectrum where the change is most significant:
Low-Frequency Event
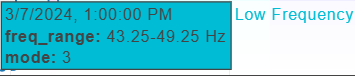
When the increase happens in the lower frequencies, a Low-Frequency Event is shown:

Again, you’ll see which part of the spectrum changed most, so you can zero in on the root cause.
Off Modes
Off modes are the absence of modes (this can happen when your machine is inactive or sensors are not sending data). They are automatically detected and plotted in gray. You can filter them out, by clicking the “Off Measurements” toggle.

Anomalies
Some measurements may not be assigned to any modes by the ModeId algorithm. These anomalies are plotted in white.
Why Modes Matter
Modes help you skip the noise and focus on what actually matters. By grouping similar measurements and alerting you only when meaningful shifts occur, they give you a clearer view of your machines — and let you make smarter, faster decisions with less effort.
You can explore Modes directly in the Deep Analysis view whenever you're investigating a machine.
Read our article about Deep Analysis view or check it out in MultiViz: