Comparing Measurements
Comparing measurements against each other — or against a healthy baseline — is one of the fastest ways to spot a developing fault. MultiViz gives you three tools for this: the Overlay Plot, the Waterfall Plot, and frequency filtering on waveform views.
Overlay Plot
Display multiple measurements directly on top of each other, revealing subtle but important differences that stacked plots can sometimes mask. This makes it easier to understand how grouped measurements or behaviors vary over time and to spot early signs of change before they become problems.
How to set it up:
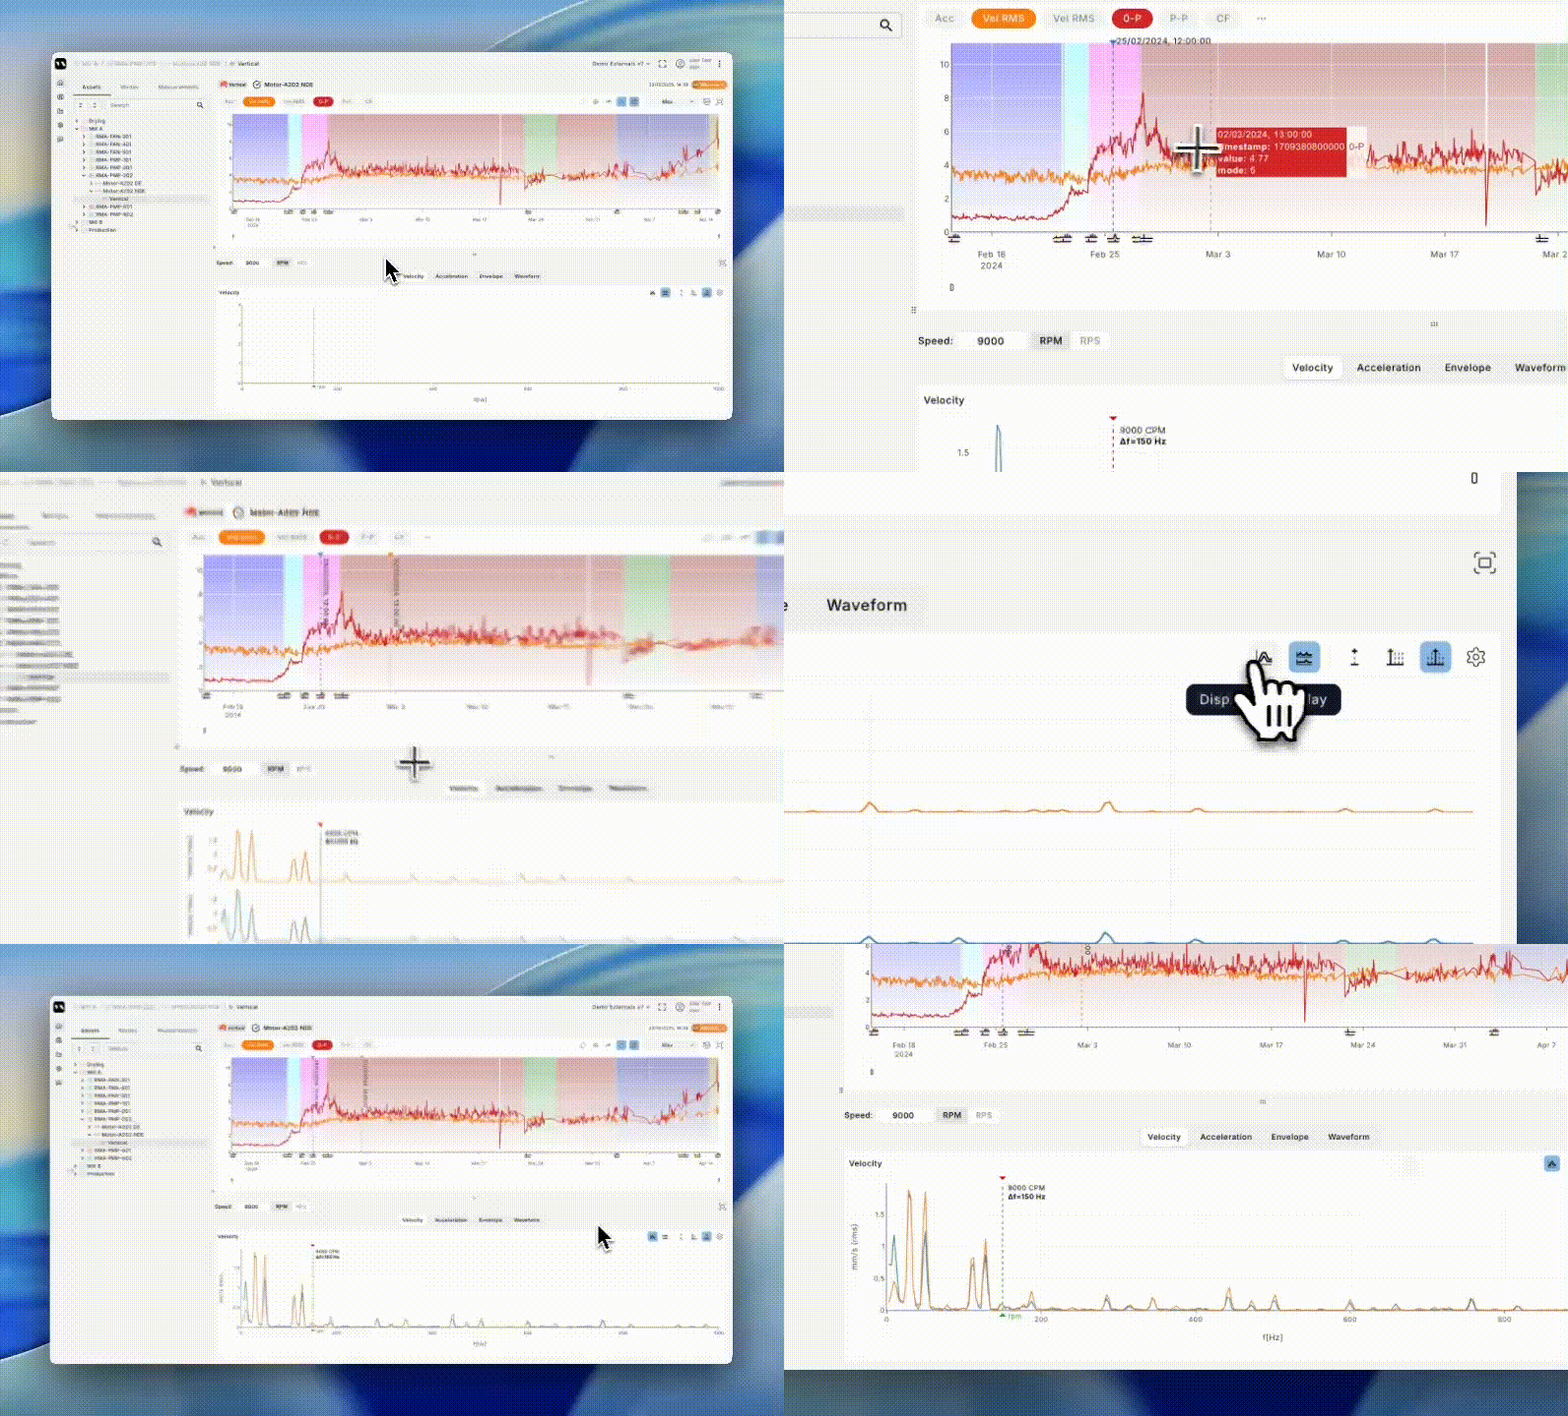
- In the Deep Analysis view, select the two measurements you want to compare in the trend plot with Ctrl+click.
- They appear stacked by default in the FFT widget.
- On top of the FFT widget, click the overlay icon, as shown below.
Waterfall plot
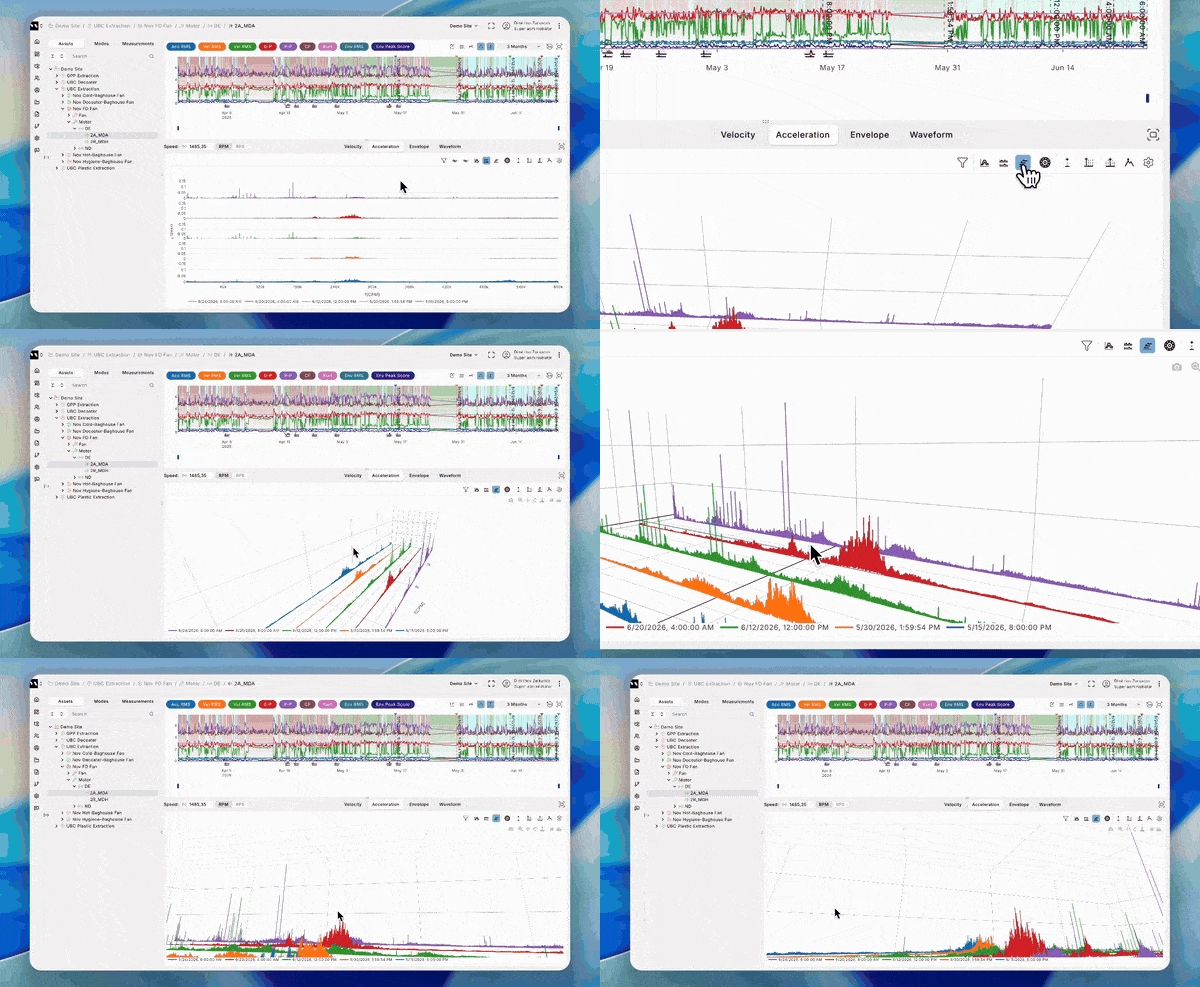
The waterfall view stacks many spectra in time order on one chart. It is useful for watching peaks grow, sidebands emerge, or harmonics build up over time — something that is hard to spot from a single spectrum snapshot.
Frequency filter on waveform views
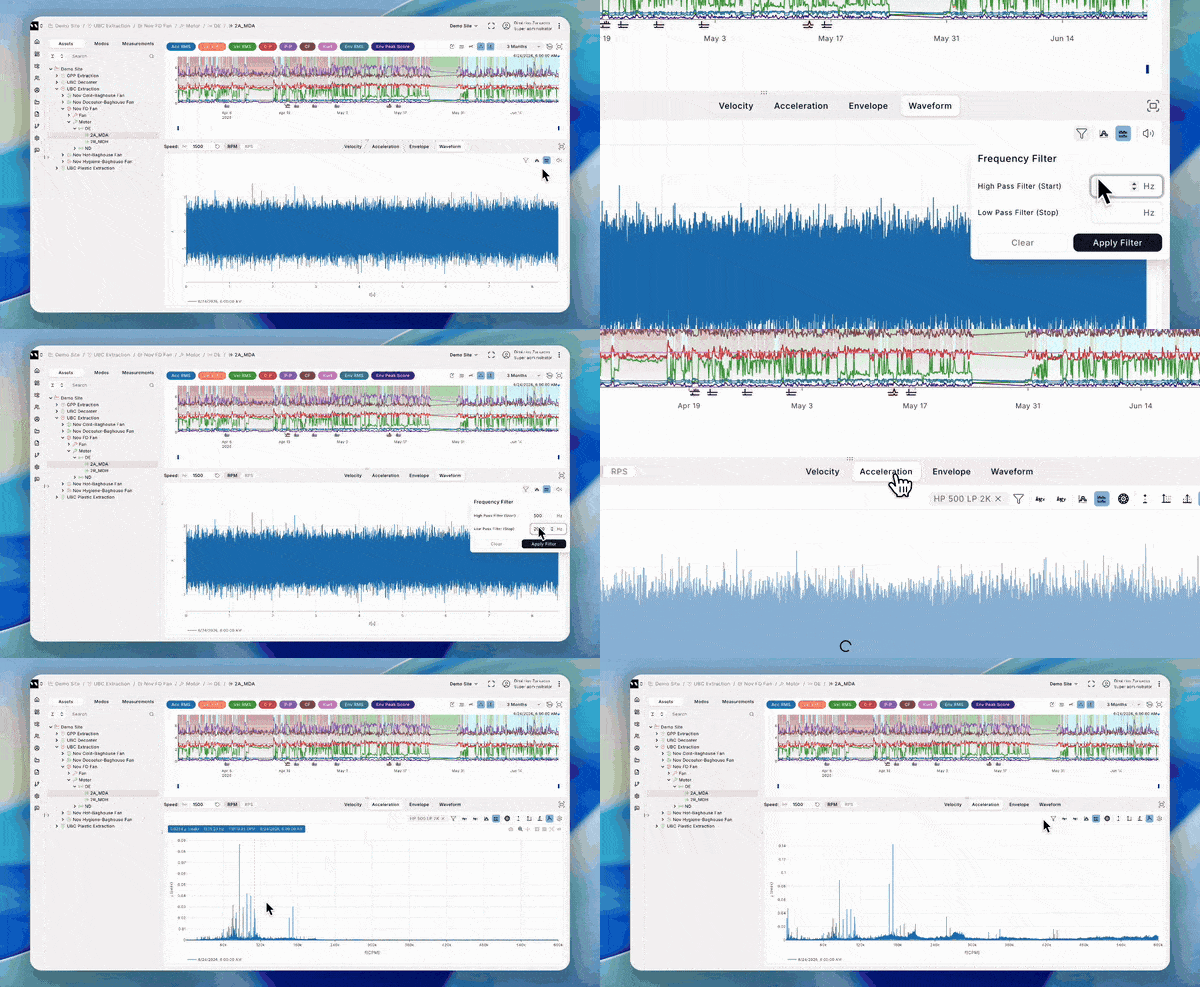
Cut out noise outside the band you care about. Set high-pass and low-pass cutoffs in Hz on waveform sources, and the filter applies to the waveform, acceleration spectrum, and velocity spectrum at once. Clear it from a badge whenever you want the full band back. (The envelope spectrum keeps its own dedicated filter.)