Working with the Spectrum (FFT)
The FFT widget in the Deep Analysis view is where you inspect the frequency content of a measurement. This article walks through the tools that make spectrum work faster and more precise: picking points, setting the running speed, working with harmonics and sidebands, zooming, and timestamps.
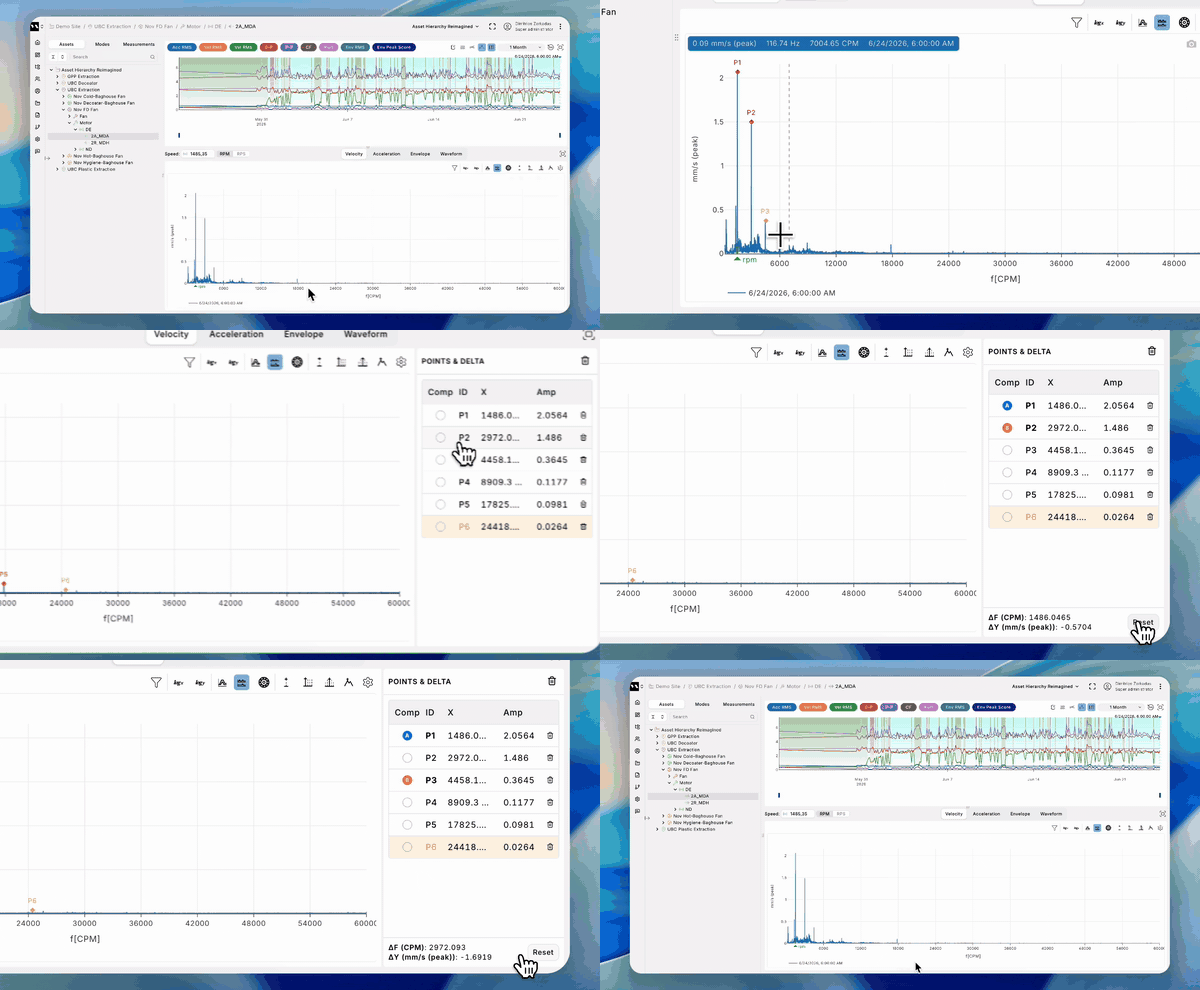
Multi-point picking
Drop multiple cursors on the spectrum and keep them in a side panel as you analyze. Ctrl+click to add a point, or press P to drop one next to the active cursor. Each point appears as a row in the side panel showing its frequency and amplitude. Click a row to make it active, then use the arrow keys to nudge it one step at a time — or Shift+arrow to snap to the next peak.
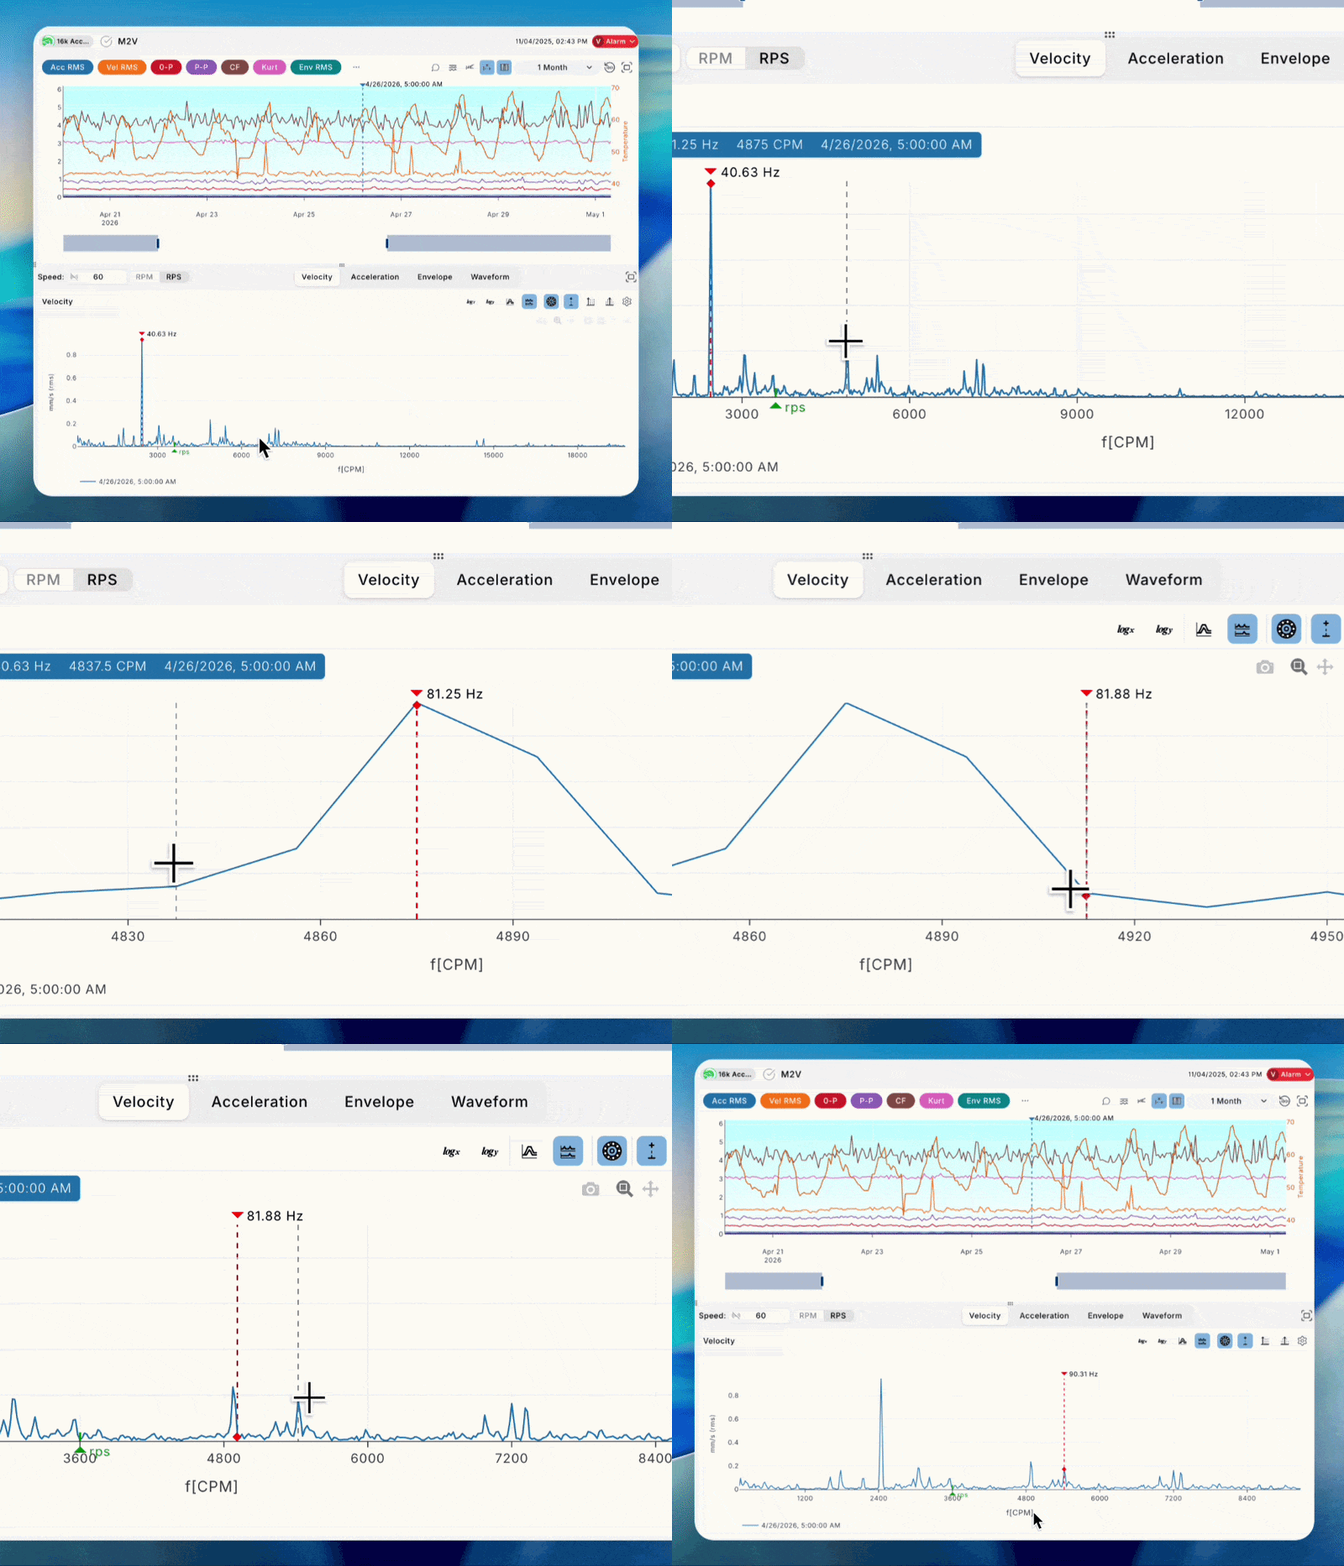
The single-cursor diamond indicator
A small diamond marker shows the exact point where the single cursor is placed, making it easy to read precise amplitude and frequency values directly from the plot.
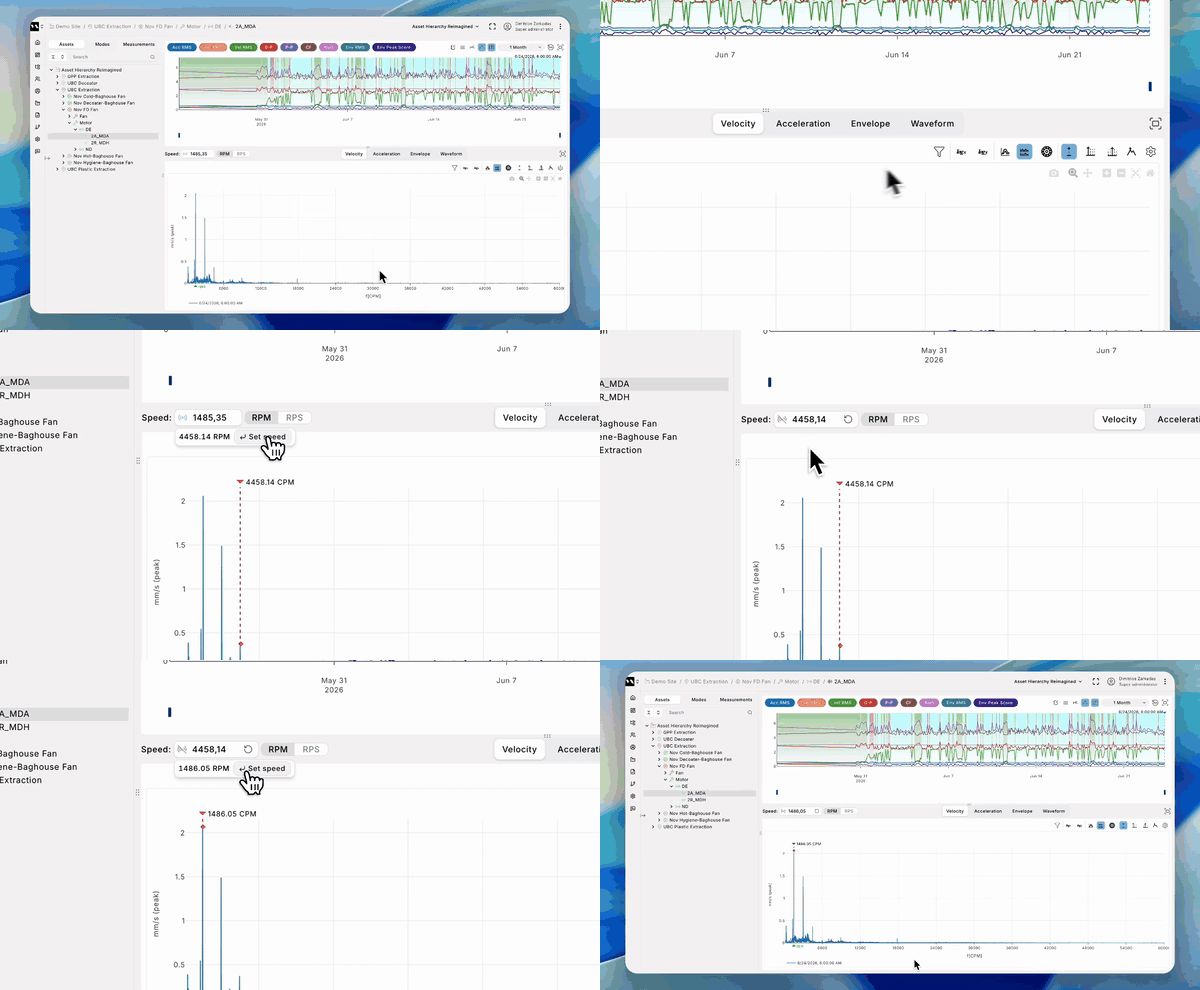
Set running speed from a point
Lock in the asset's RPM straight from the spectrum. With the single cursor active, click any peak, then press Enter — the running speed is set from that frequency.
Harmonic families at a glance
See every harmonic family MultiViz has detected for the current spectrum. Hover the harmonic tool to preview the list, and click one to load it onto the chart instantly.

Drag any sideband line
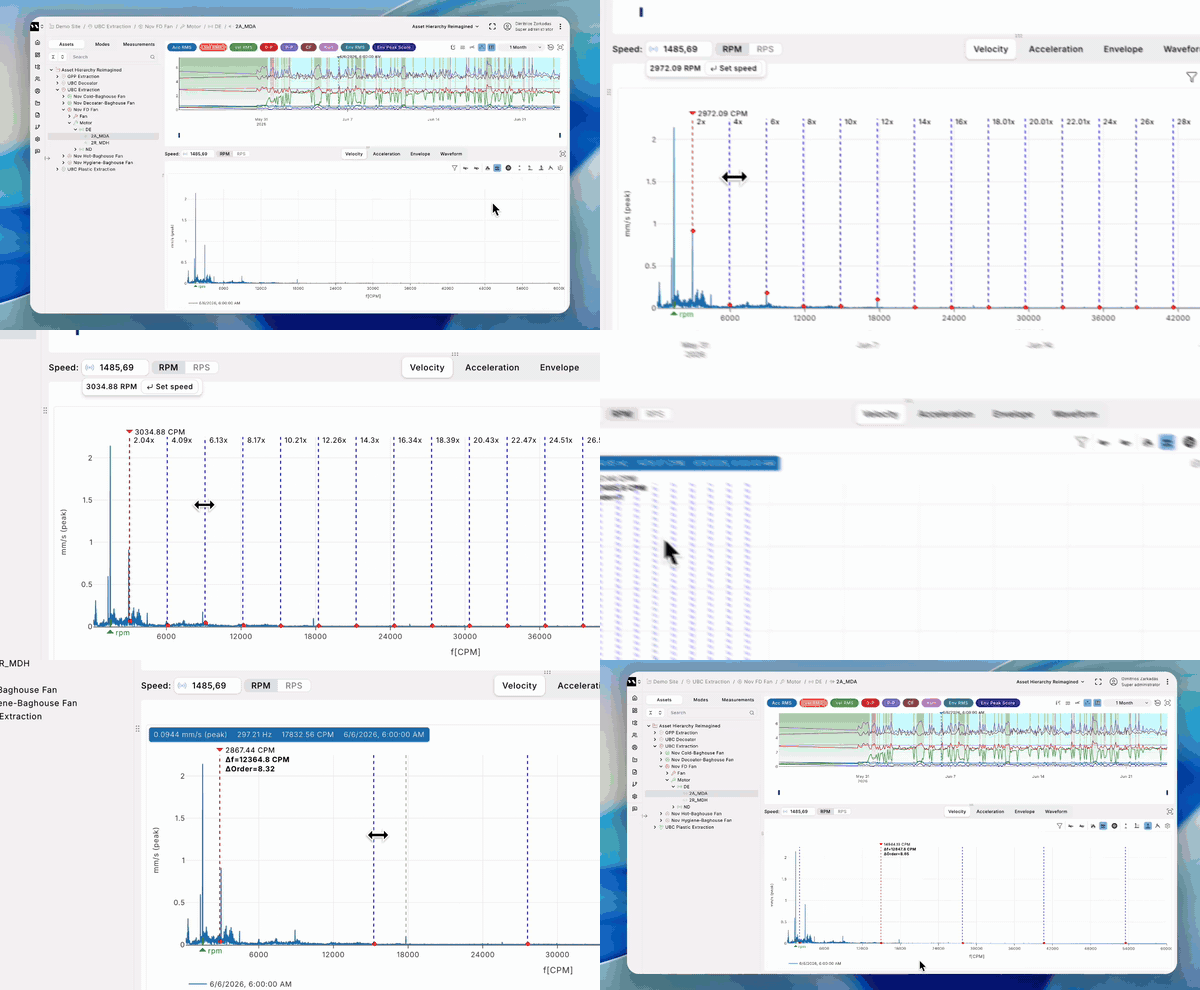
Grab any sideband line on the plot and drag it to retune the spacing — not just the first one. This is much faster when the feature you want to align is far from the carrier.
Zoom on the Y-axis
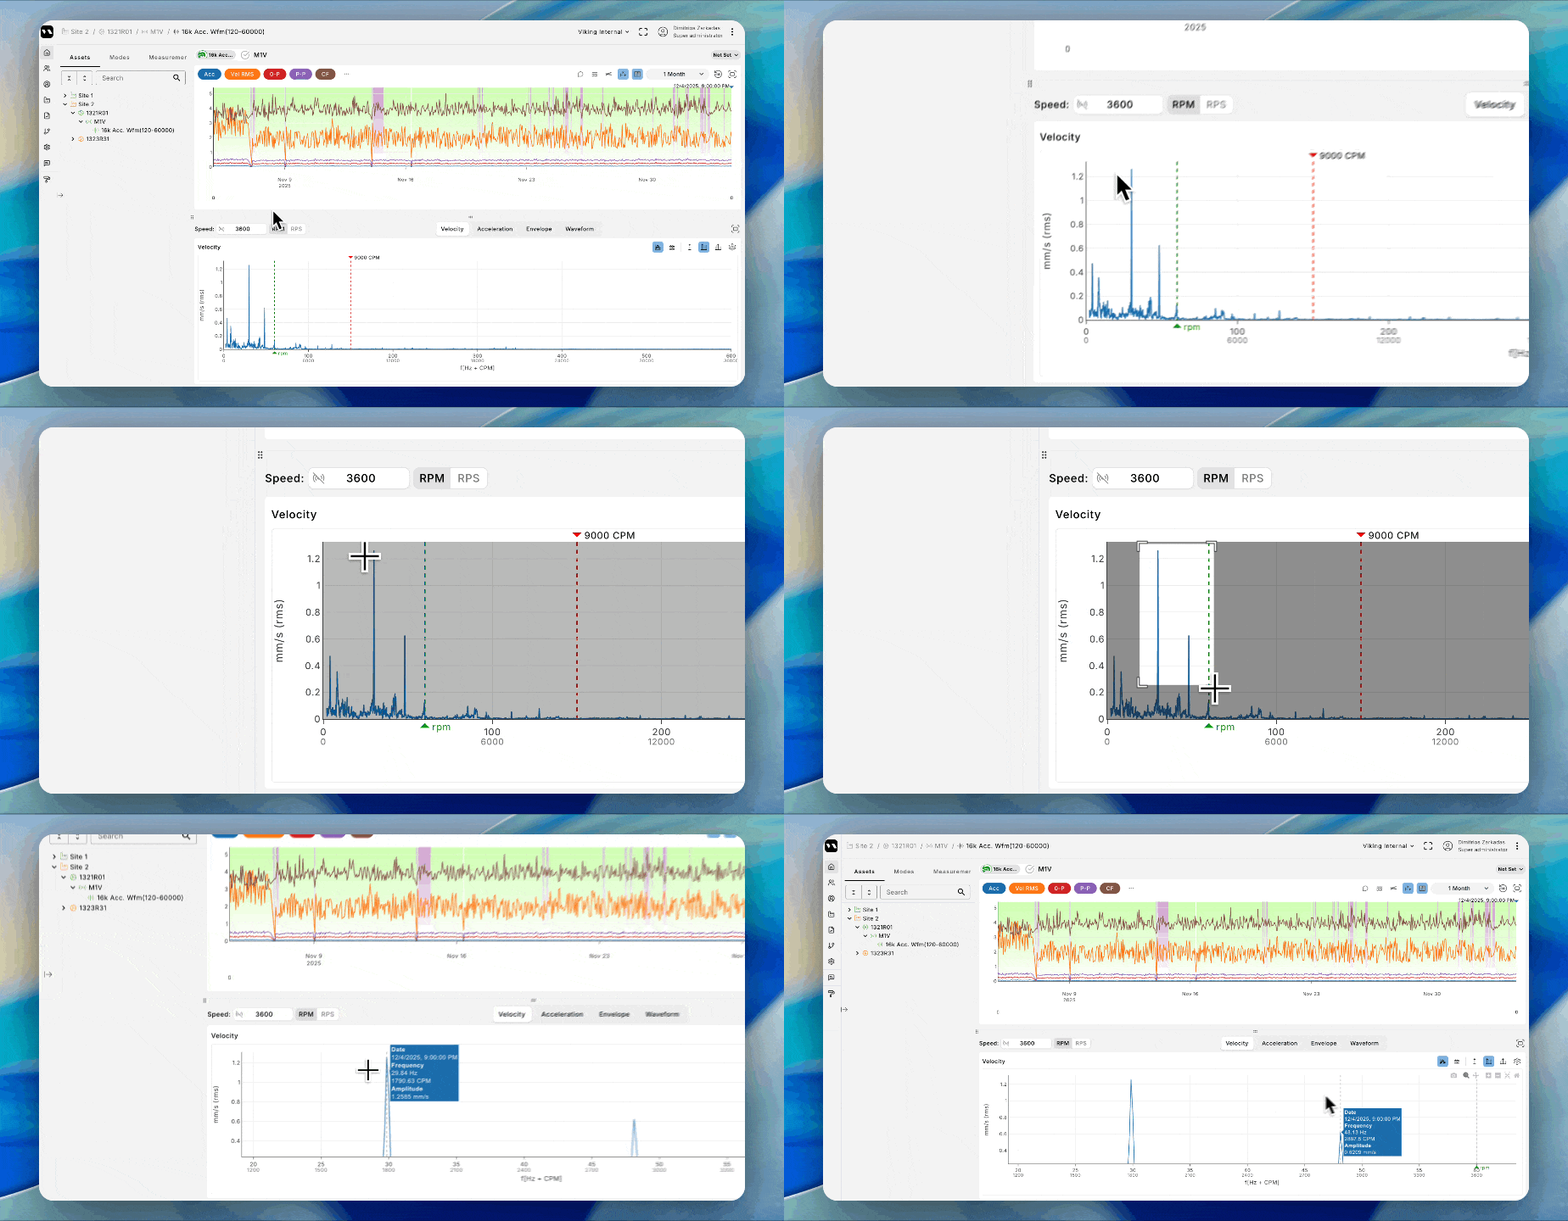
Click and drag vertically on the spectrum plot to box-zoom on the y-axis for precise amplitude or magnitude control.
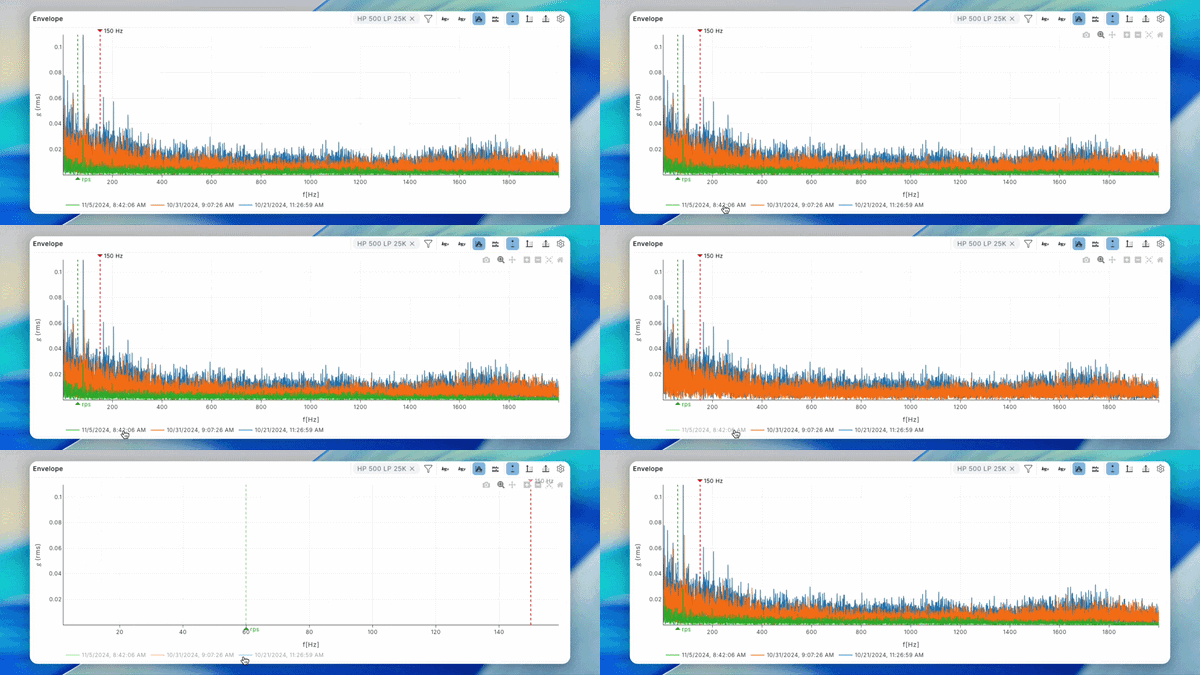
Timestamps on FFT plots
Timestamps appear directly on FFT plots for both single and multiple measurements, and they are preserved when you download the plot as an image. You can also toggle them interactively:
- Click once to hide the timestamp
- Click twice to isolate and display only the timestamp