October Improvements Roundup
October brought many diverse updates:
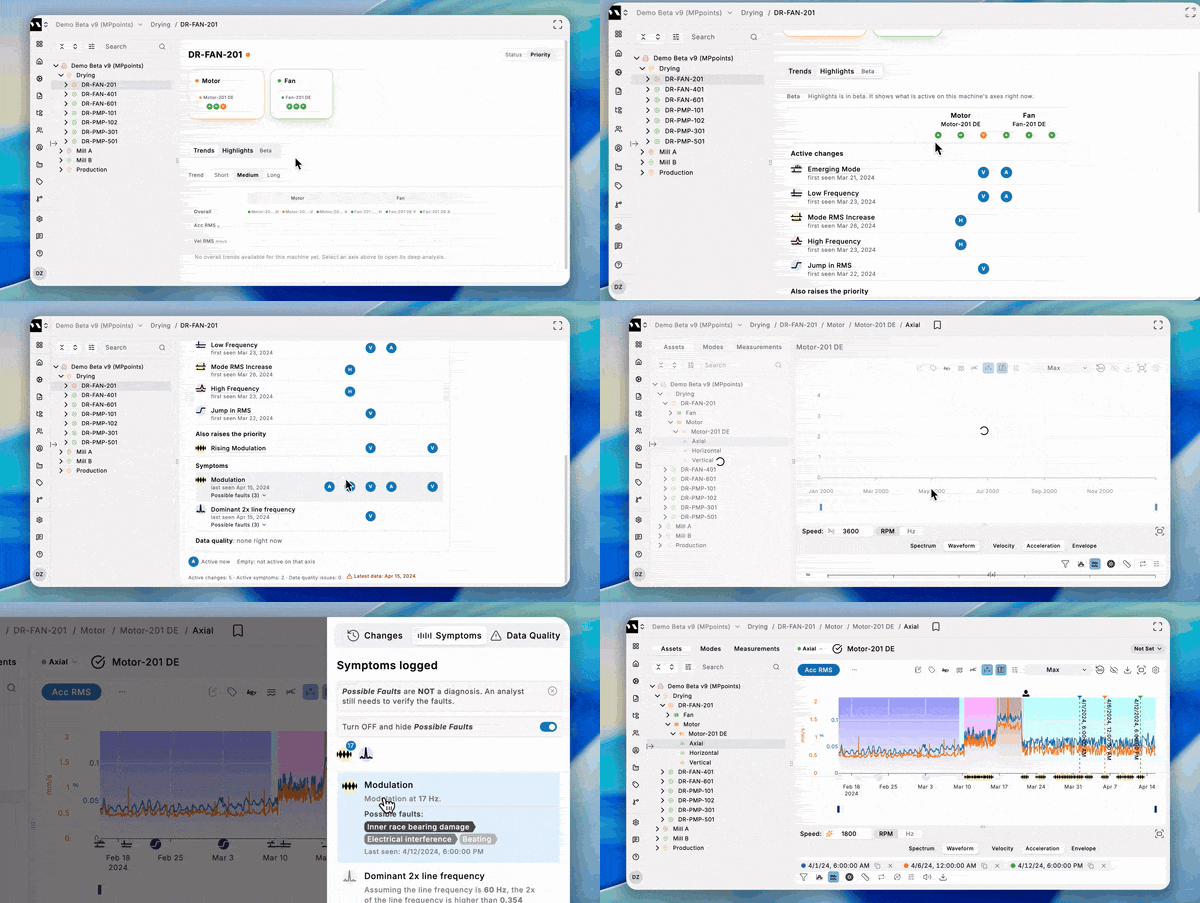
Machine highlights tab (in Beta)
See what needs attention on a machine in one place. The new tab lists active changes, symptoms and data issues for each axis. Click an item to open it in deep analysis.
Disconnection emails
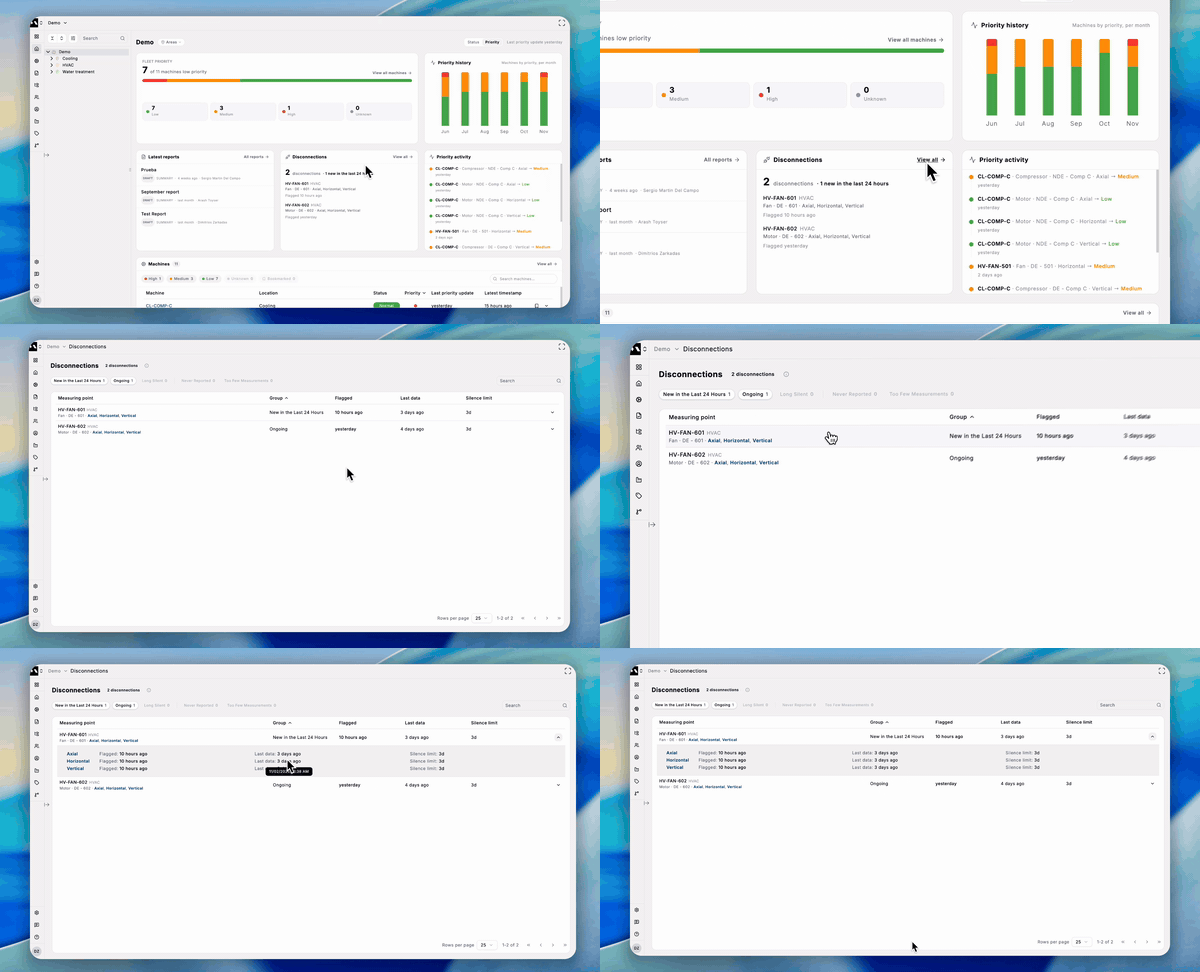
Get an email when a sensor stops sending data. To turn it on, go to your profile and switch on "Disconnection emails".
The Disconnections page is also new. Sensors are grouped as New, Ongoing and Long silent (no data for 30+ days), with filters and search. Each site card shows its count.
Set the trend scale
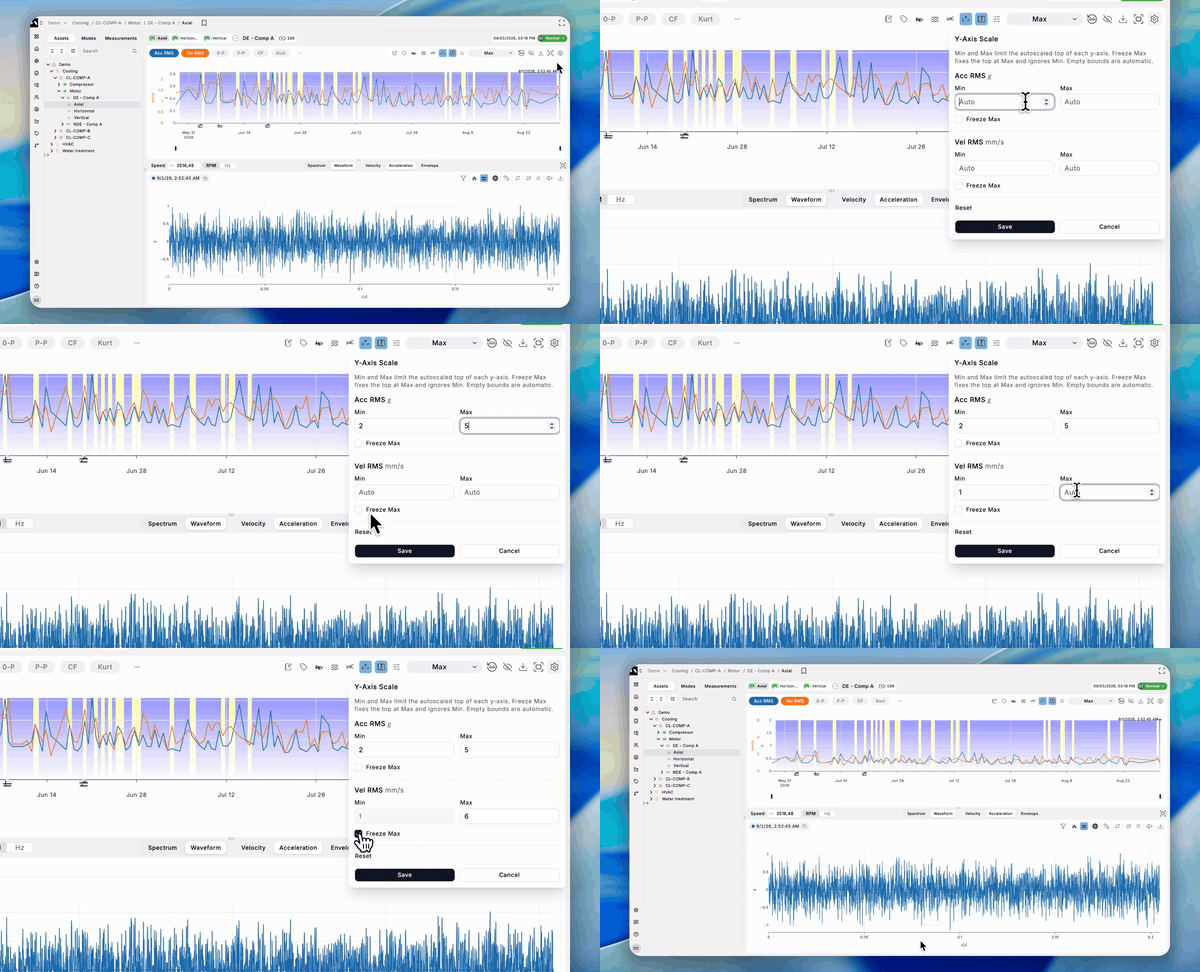
Stop one big peak from flattening the trend. Set a min and max for each KPI's y-axis, or freeze the max. Your settings are saved.
The sensor trends on the machine page also get a Log Y option.
Gentler smoothing
The smoothing slider now has 10 steps instead of 5. The first step is much lighter.
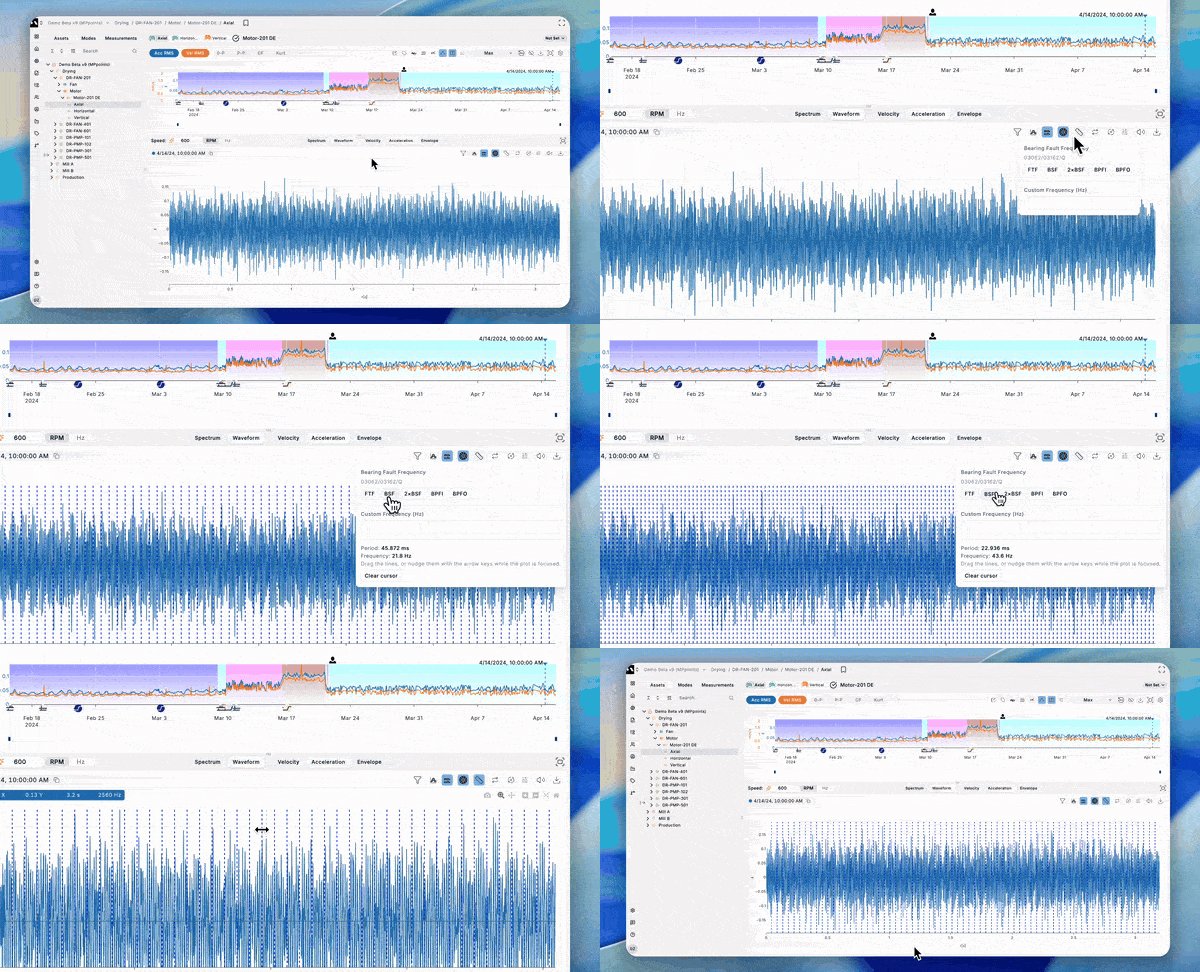
Waveform interval cursor
Check if impacts repeat at a bearing fault frequency. Pick a frequency or type one, then drag the grid into place.
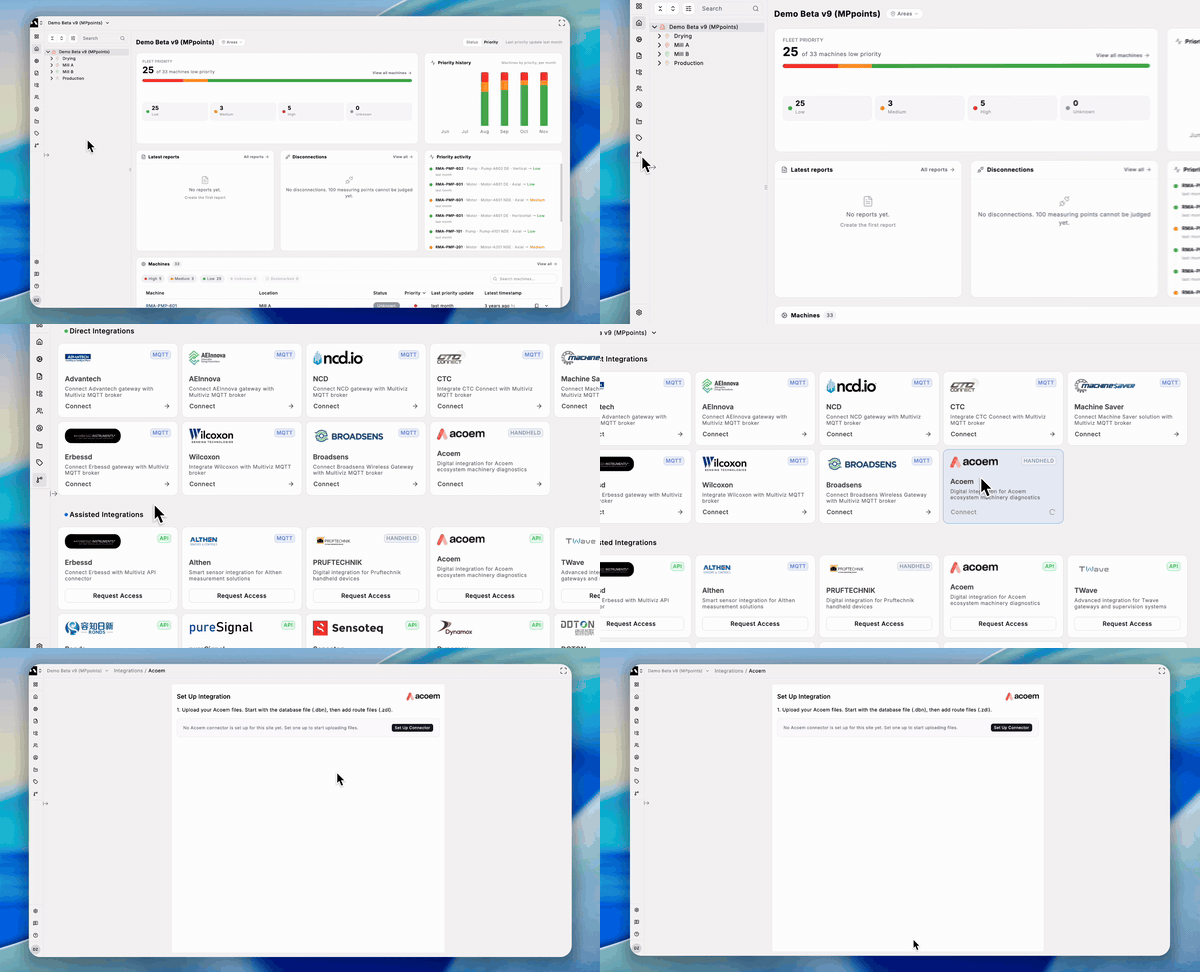
ACOEM handheld integration
Upload ACOEM handheld files (.dbn, .zdl) from the browser, on the site's Integrations page. Follow each upload and start a sync.
Reports follow the asset tree
New reports list machines in the same order as your asset tree. "Pump 2" now comes before "Pump 10".
Faster machine pages
Moving between machines is now about twice as fast. A spinner shows while the next machine loads.