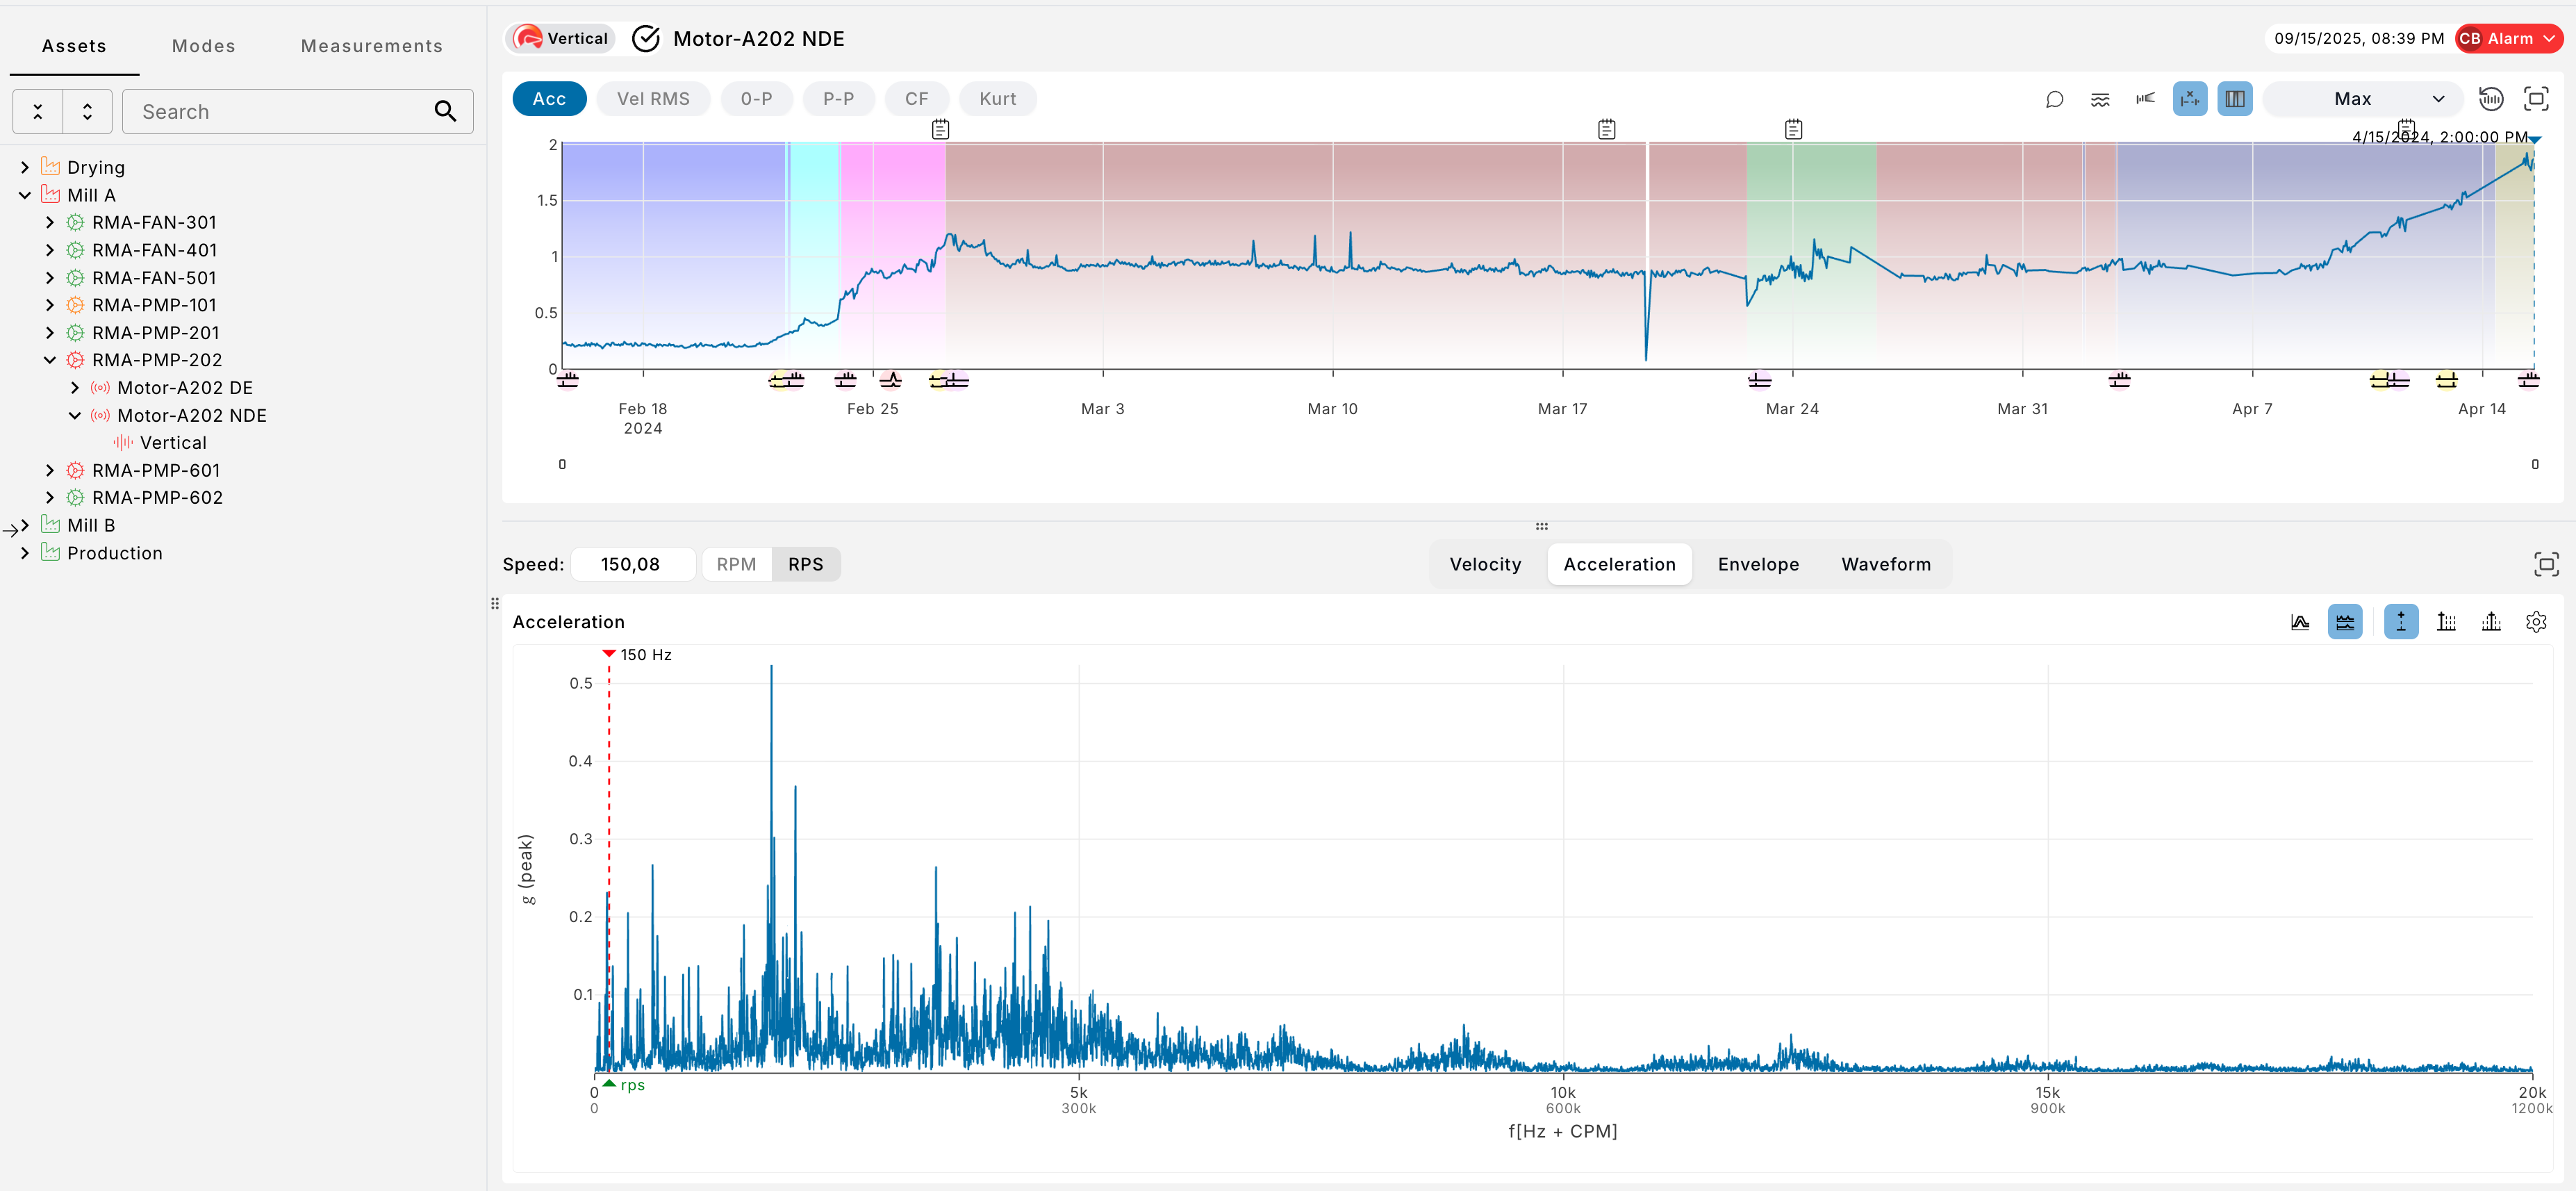
Trend Plot Tools
The trend plot tracks your vibration KPIs over time and is usually the first place a developing problem shows up. These tools help you read it faster and isolate exactly what you want to see.
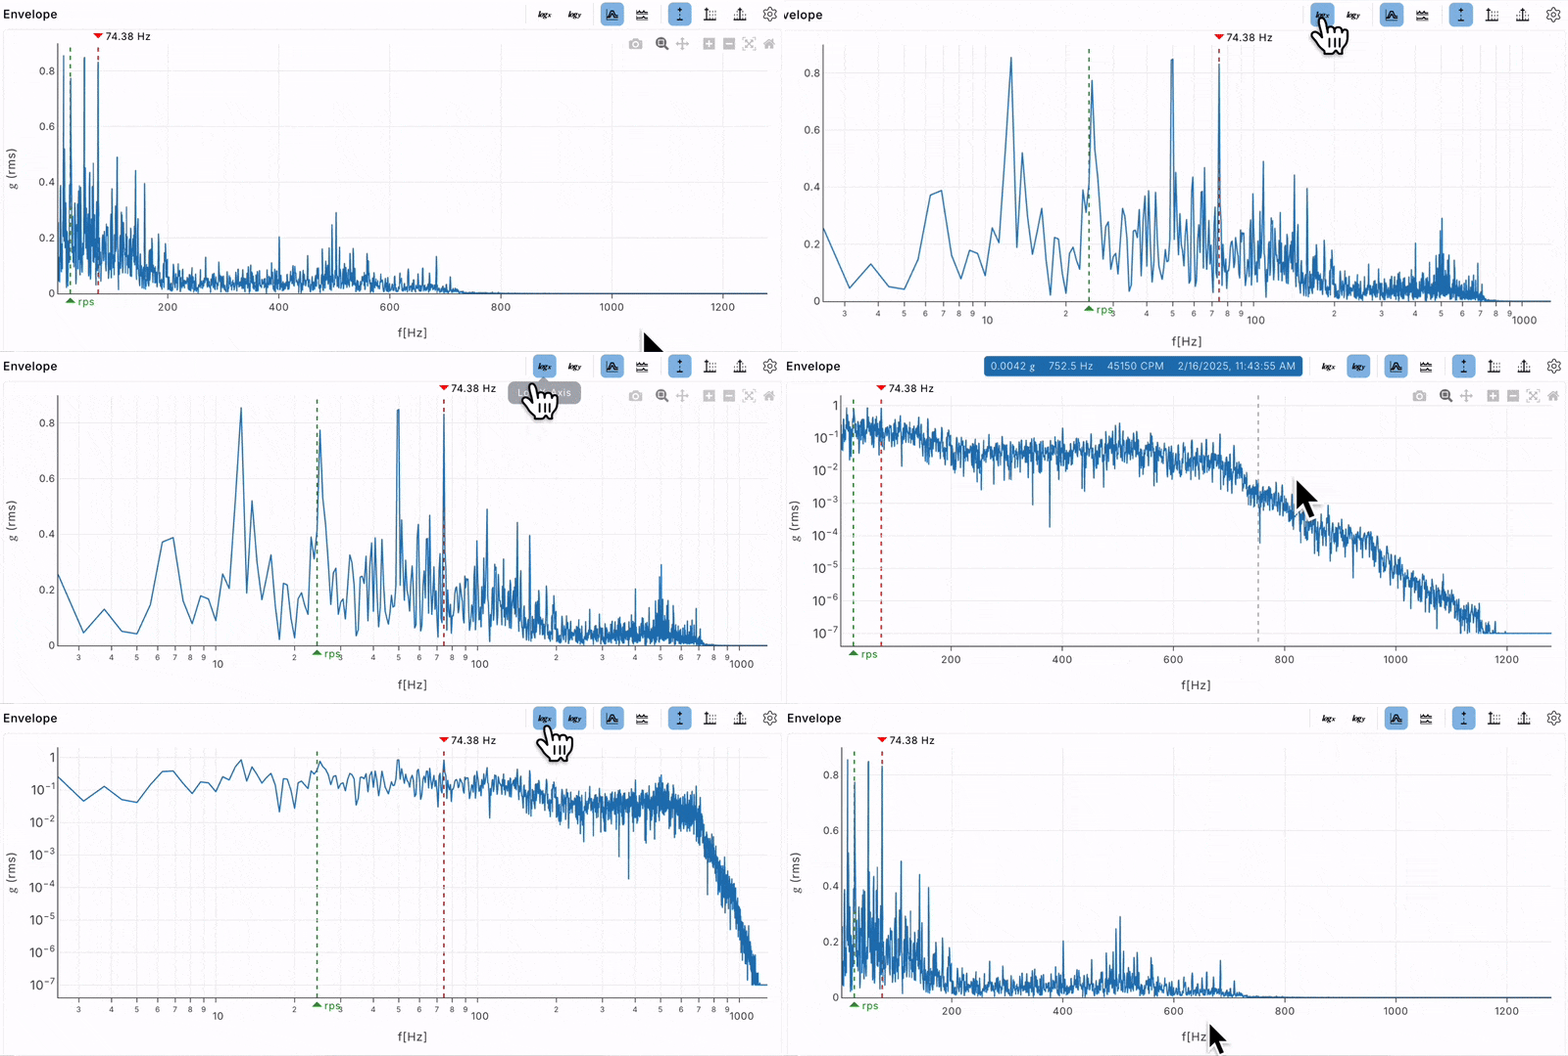
Logarithmic scaling
Toggle logarithmic scaling on velocity, acceleration, and envelope charts. This makes it easier to visualize signals with wide dynamic ranges and uncover details that are hard to see on a linear scale.
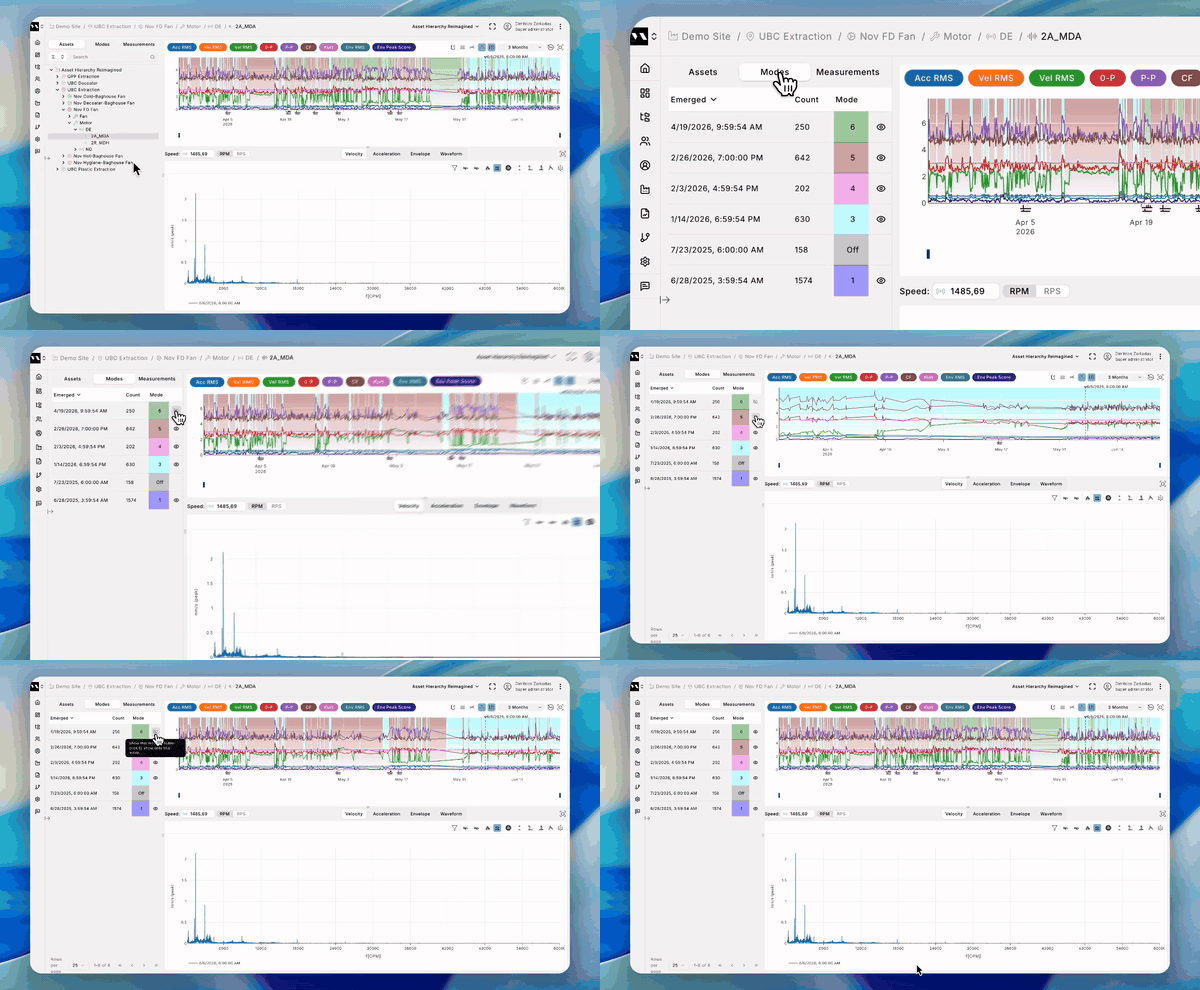
Hide modes from the KPI trend
Isolate one operating regime at a time. Each row in the Modes tab has a show/hide toggle — hiding a mode pulls its measurements and related symptoms out of the trend chart.
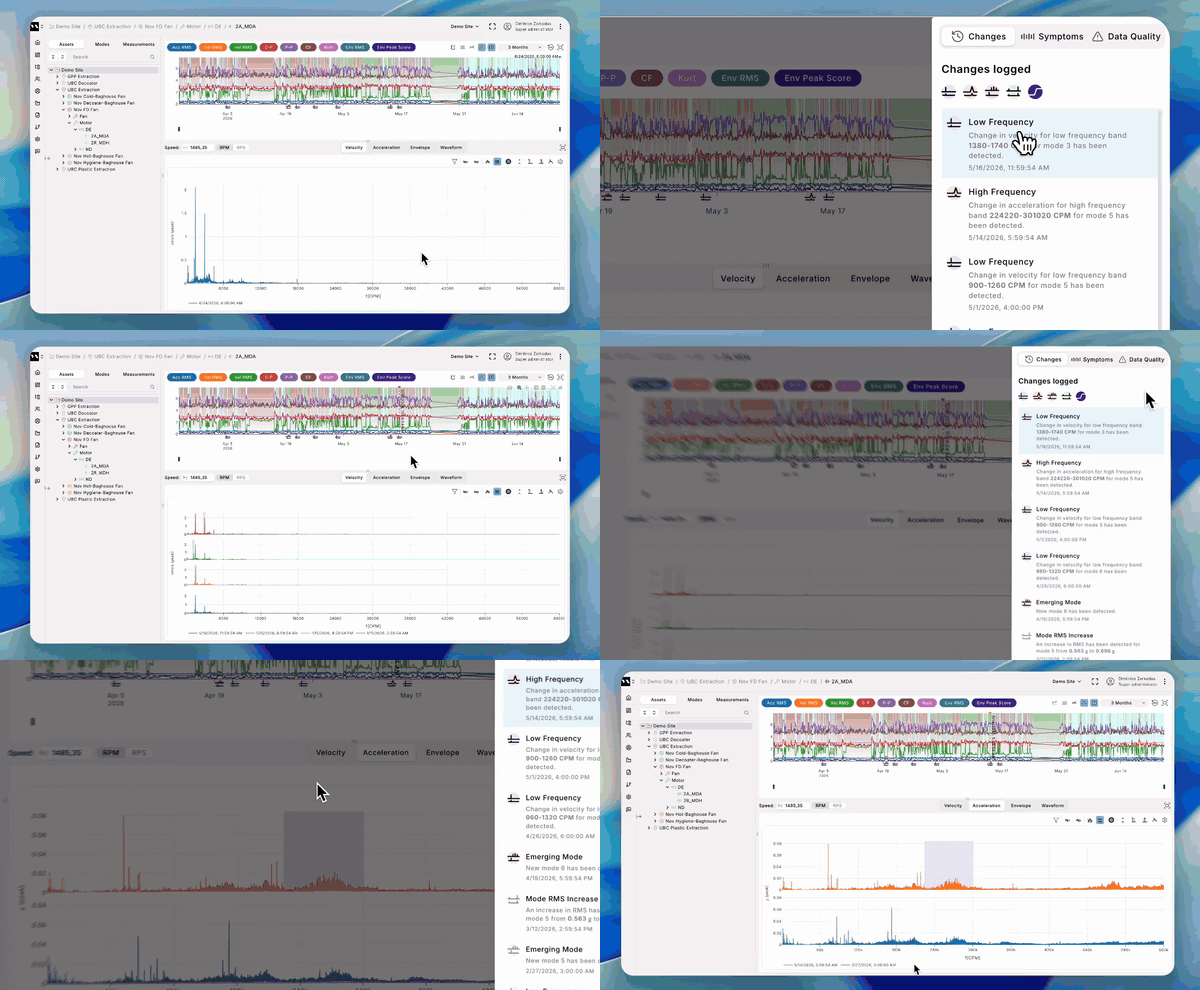
Spot the change
Selecting a detected change or symptom on the KPI trend highlights the area on the spectrum that drove it, so you know exactly where to look first.
The acceleration RMS "jump detector"
MultiViz automatically detects sudden increases in acceleration RMS — no thresholds to configure. This identifies RMS jumps fast and notifies you earlier when critical changes occur.

Latest measurement auto-selected
When you open a sourced asset, MultiViz automatically highlights the most recent measurement — no empty screens or extra clicks; you land straight where you need to be.
Before:
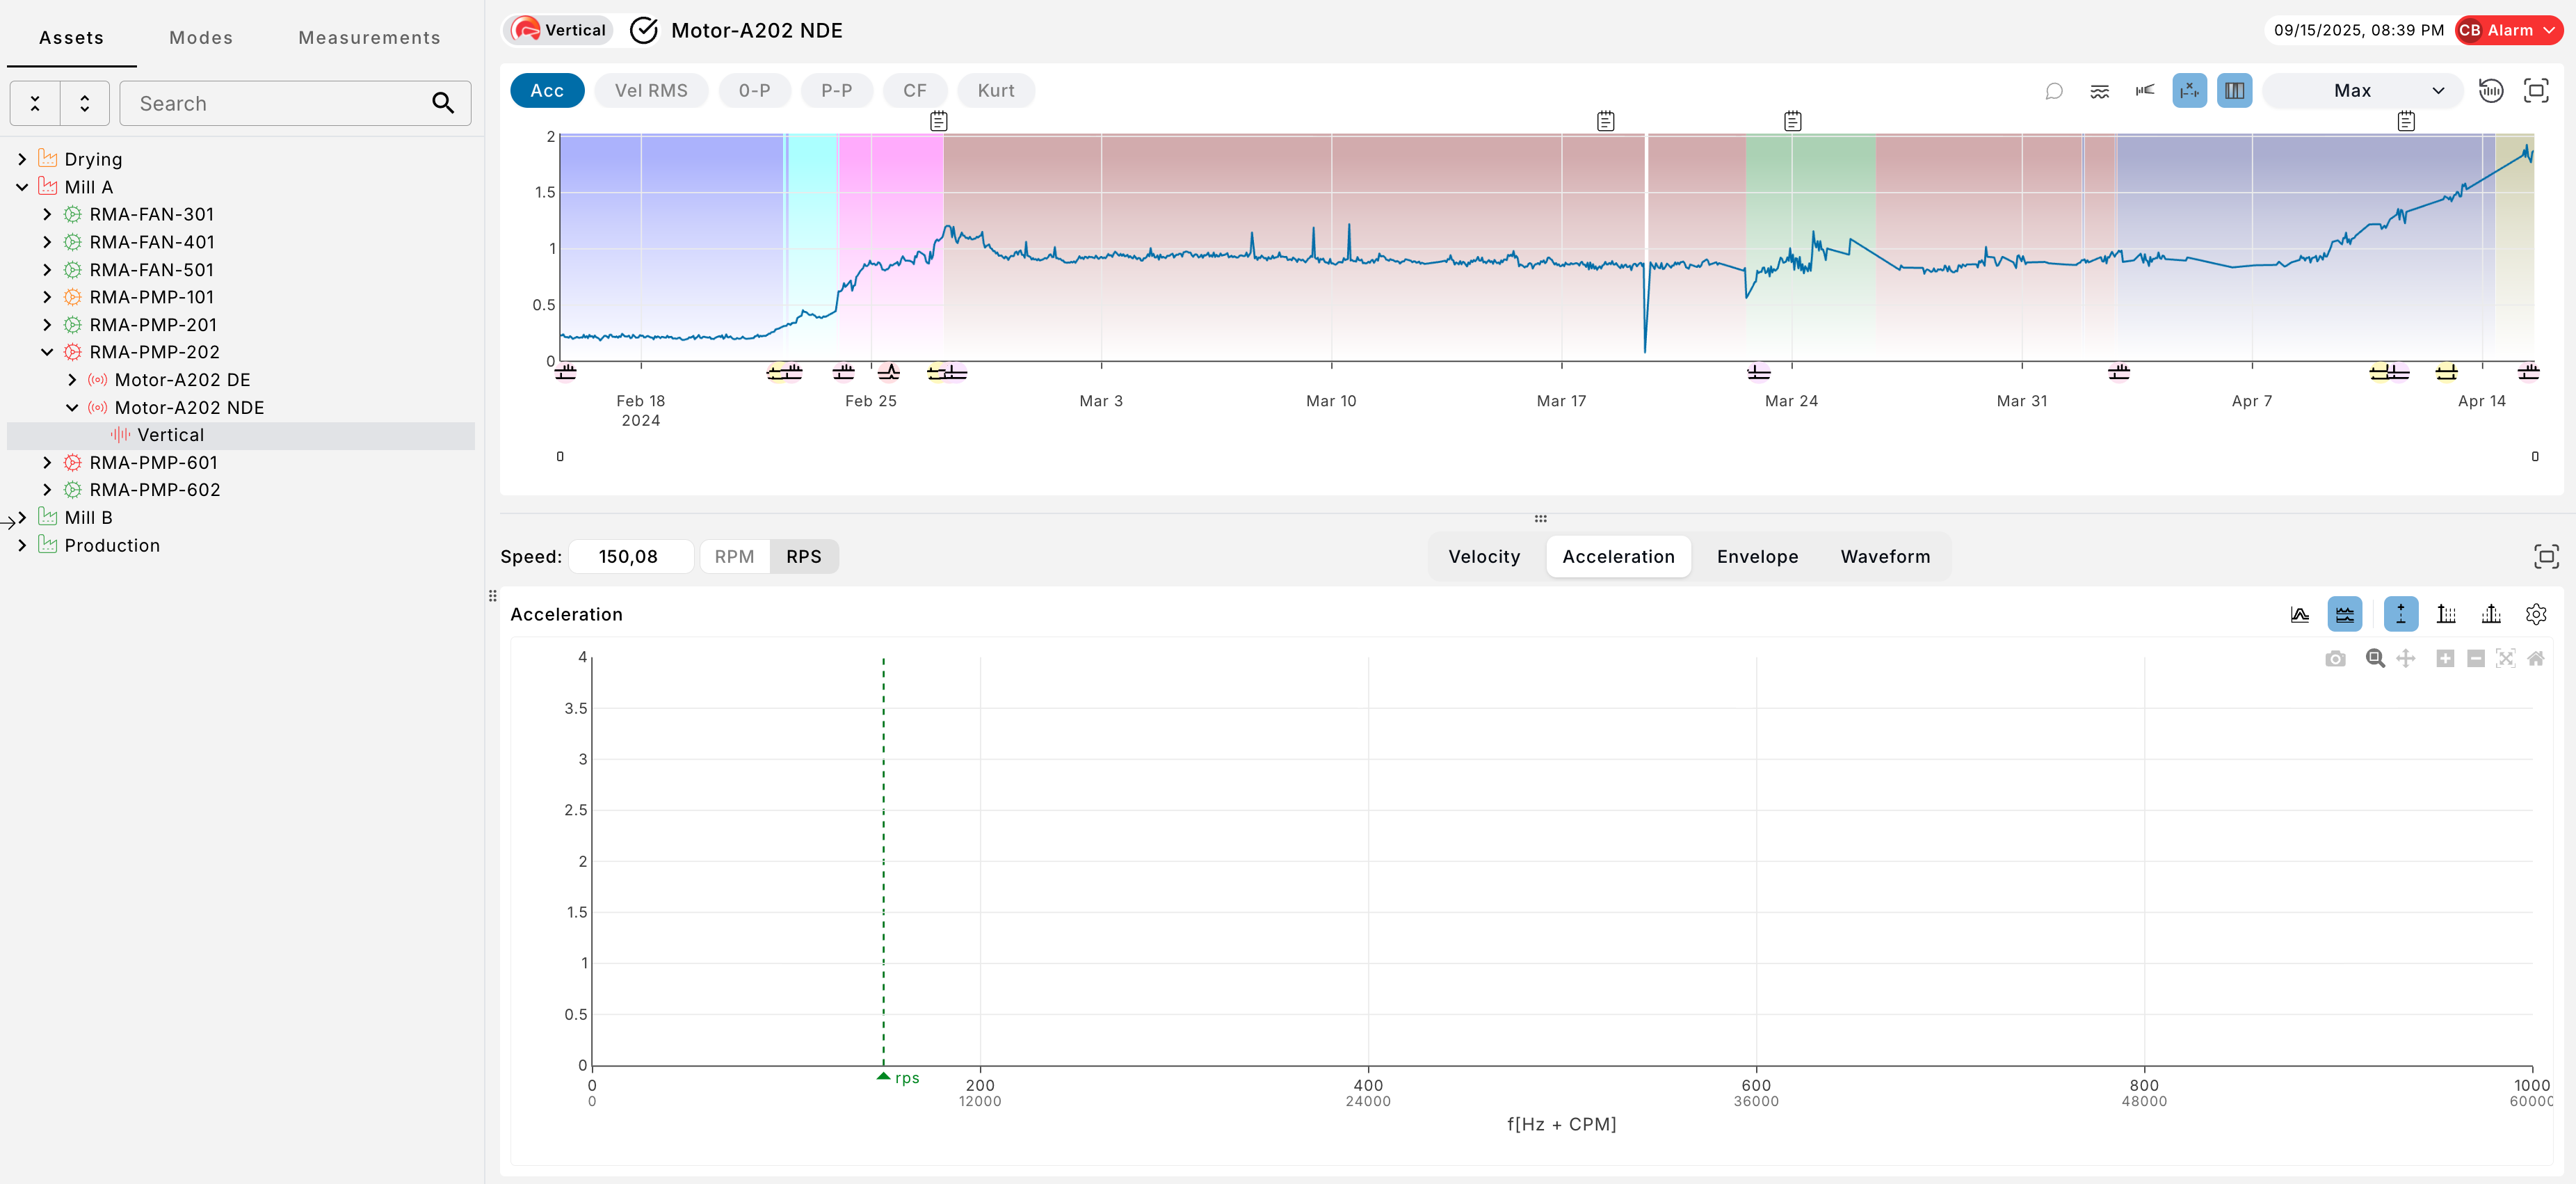
After: