
How to detect a bearing failure in Multiviz
How to Identify a Bearing Fault Using Multiviz
In this example, we’ll walk through how to detect a bearing fault by exploring changes in vibration data, using trends, modes, and envelope analysis. The process involves spotting subtle changes, identifying harmonic patterns, and tracking how the signal evolves over time.
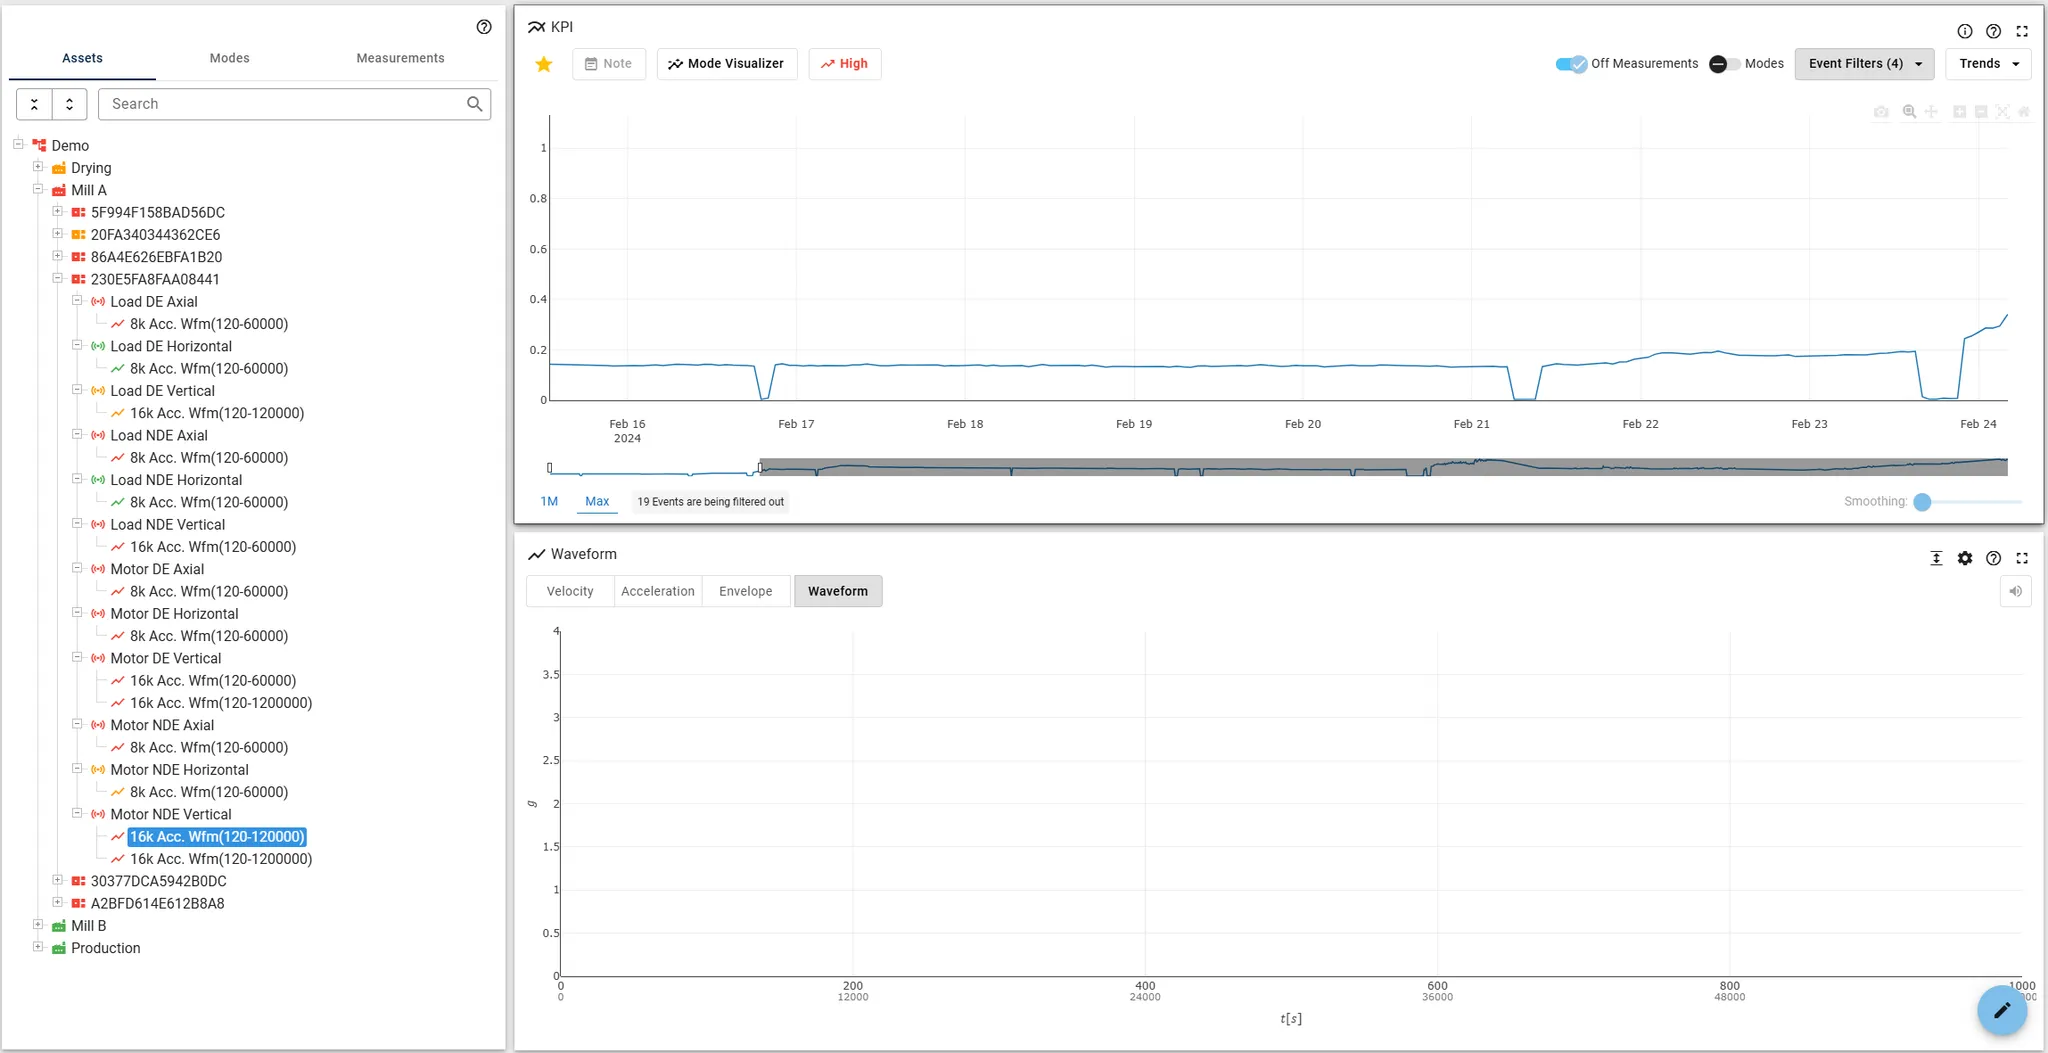
1. Start with the Trends
We start by selecting the specific sensor we want to analyze and open the “Deep Analysis View”. If we start by looking at trends only (no modes or events), the raw trend data doesn’t show any significant changes. Everything looks relatively stable.
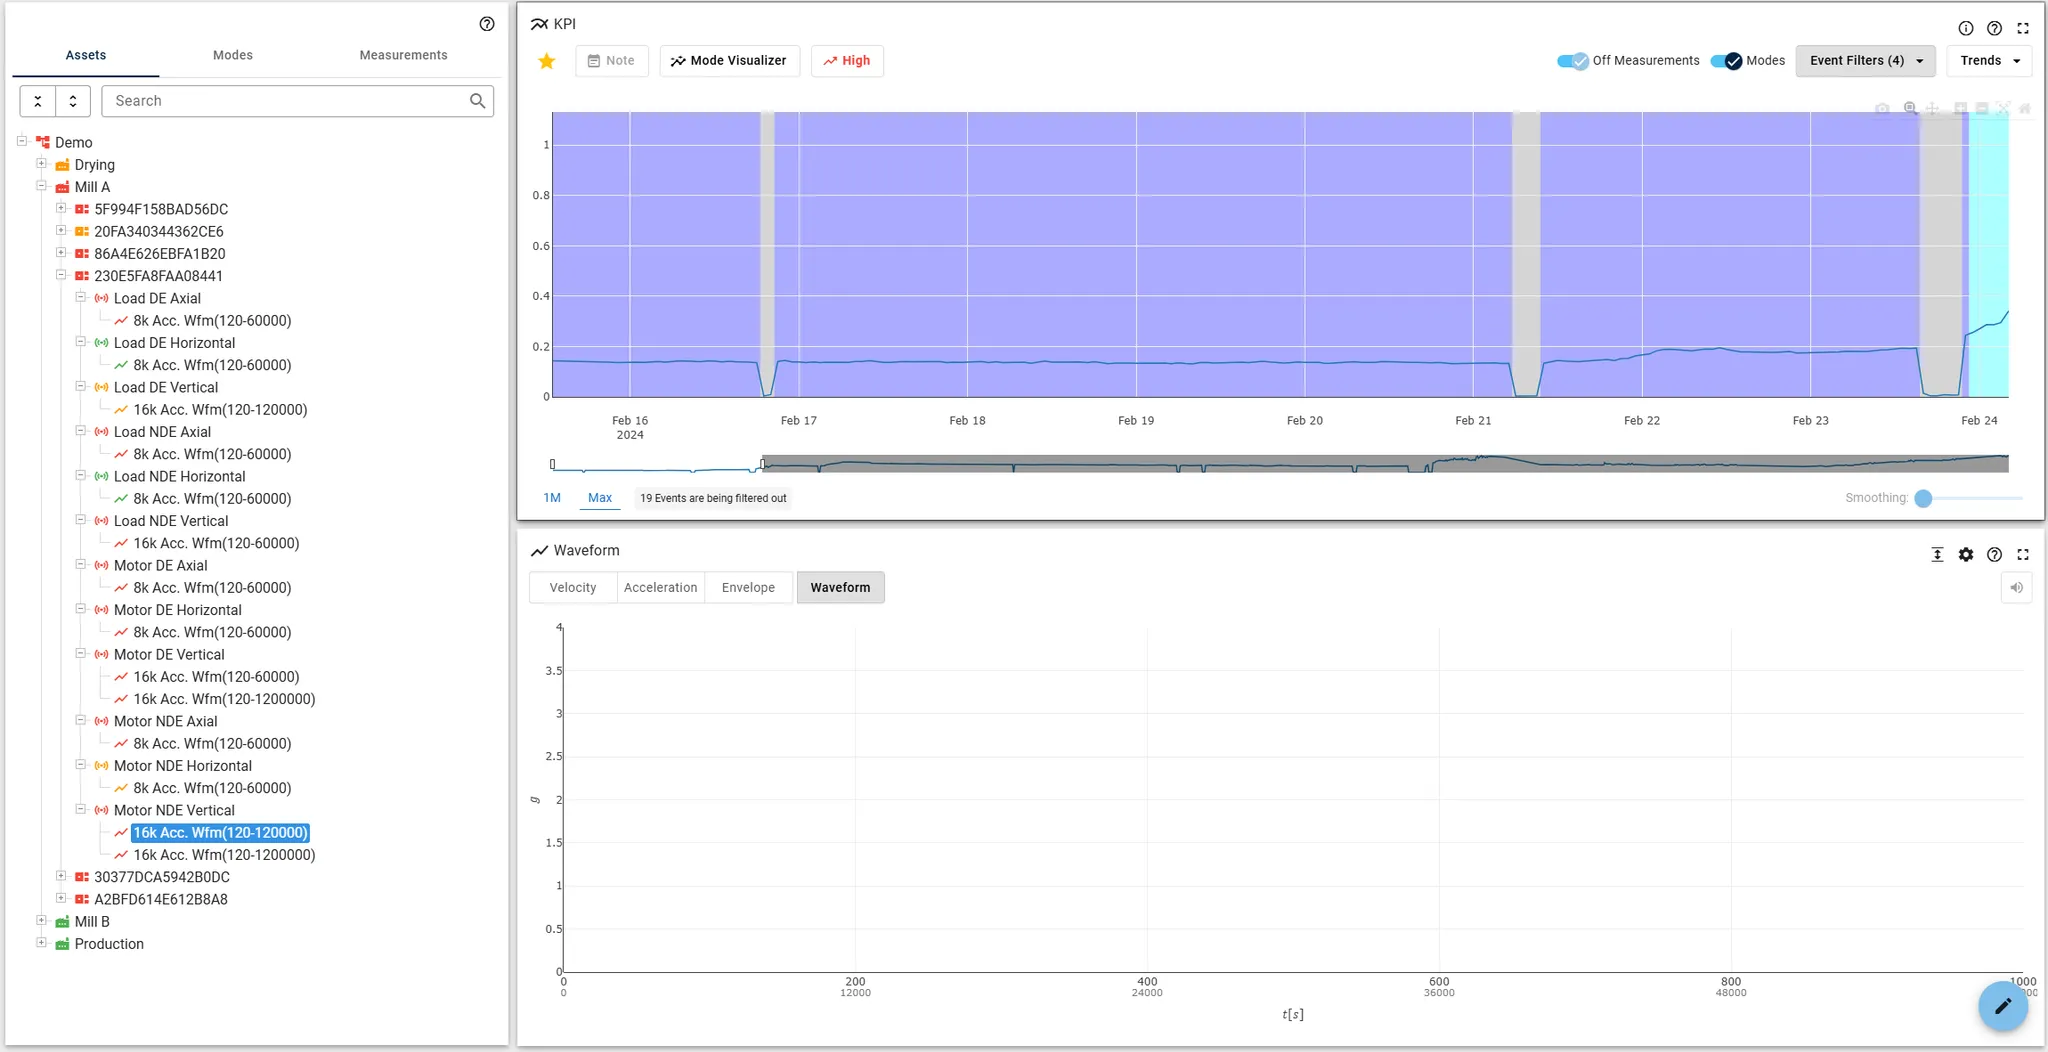
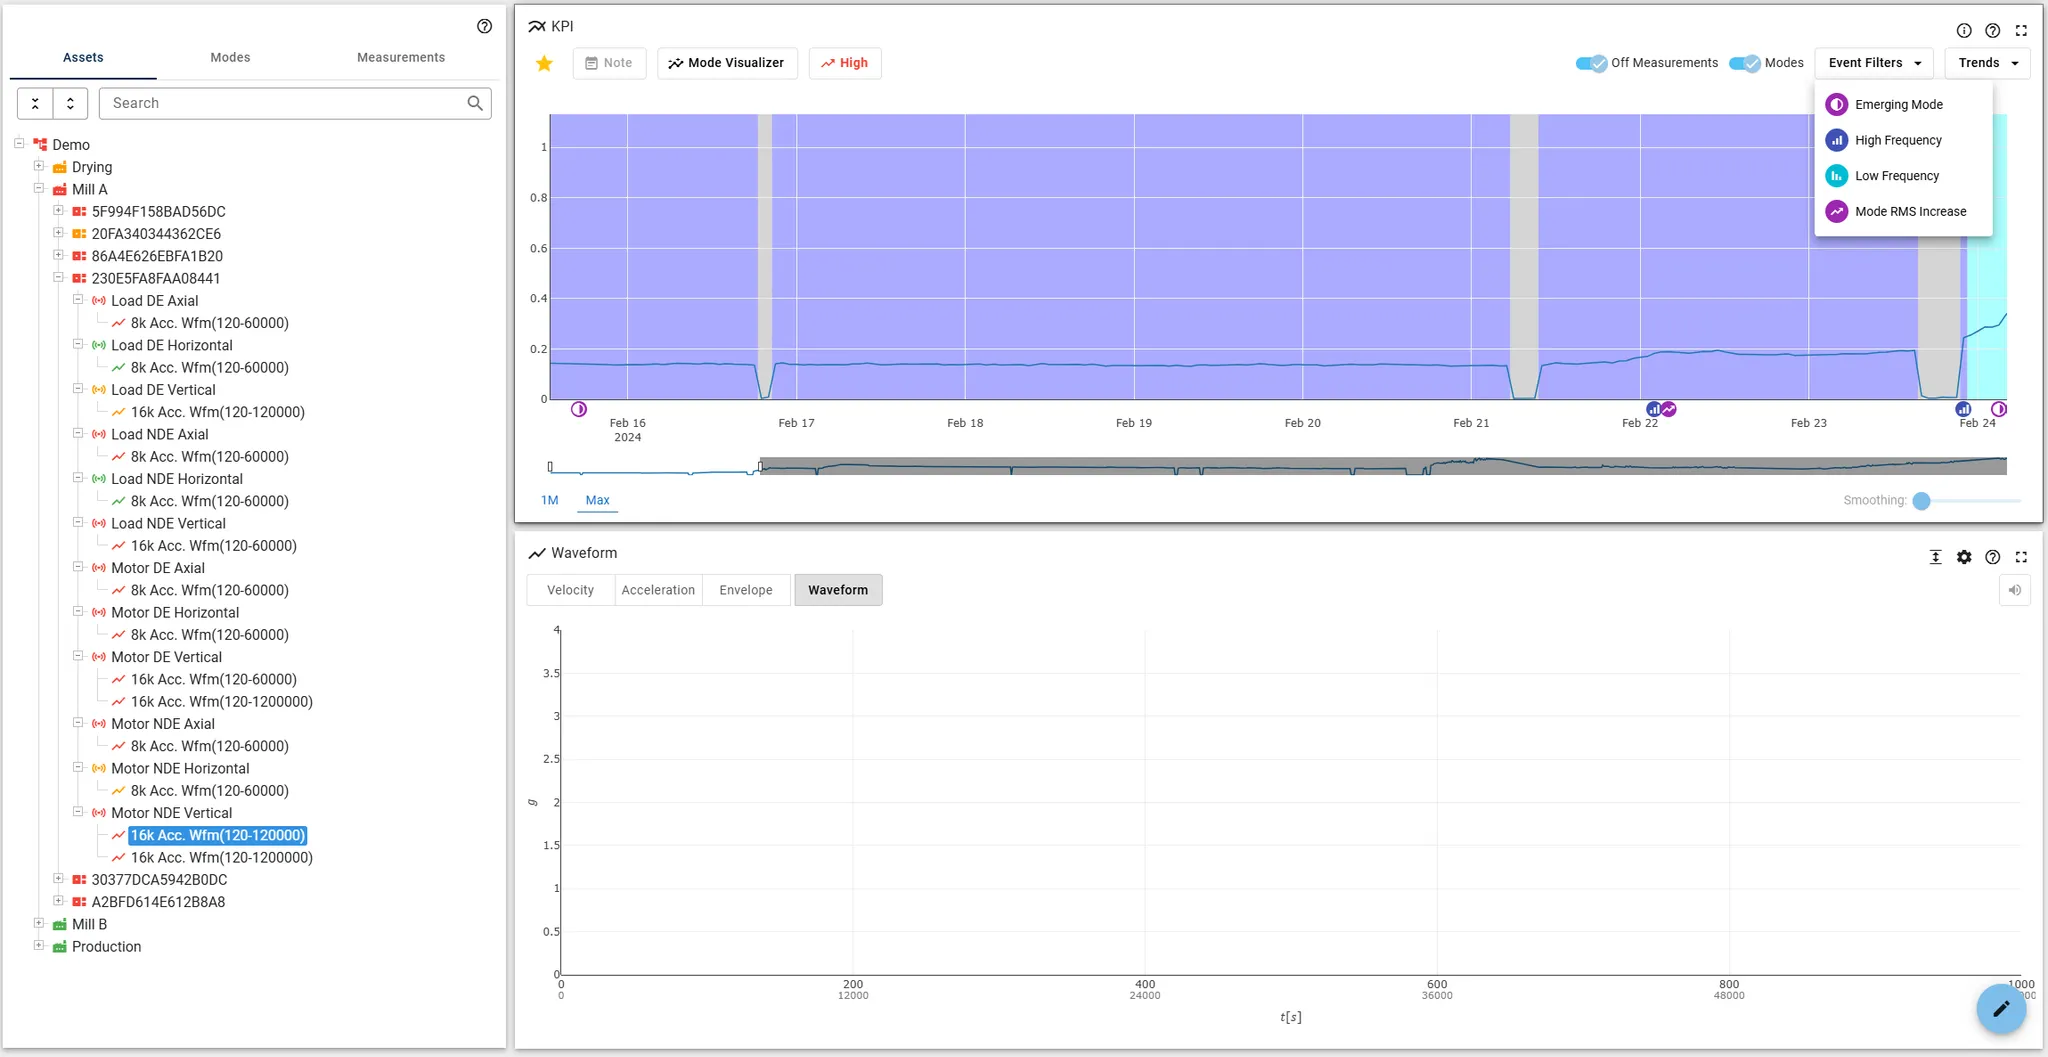
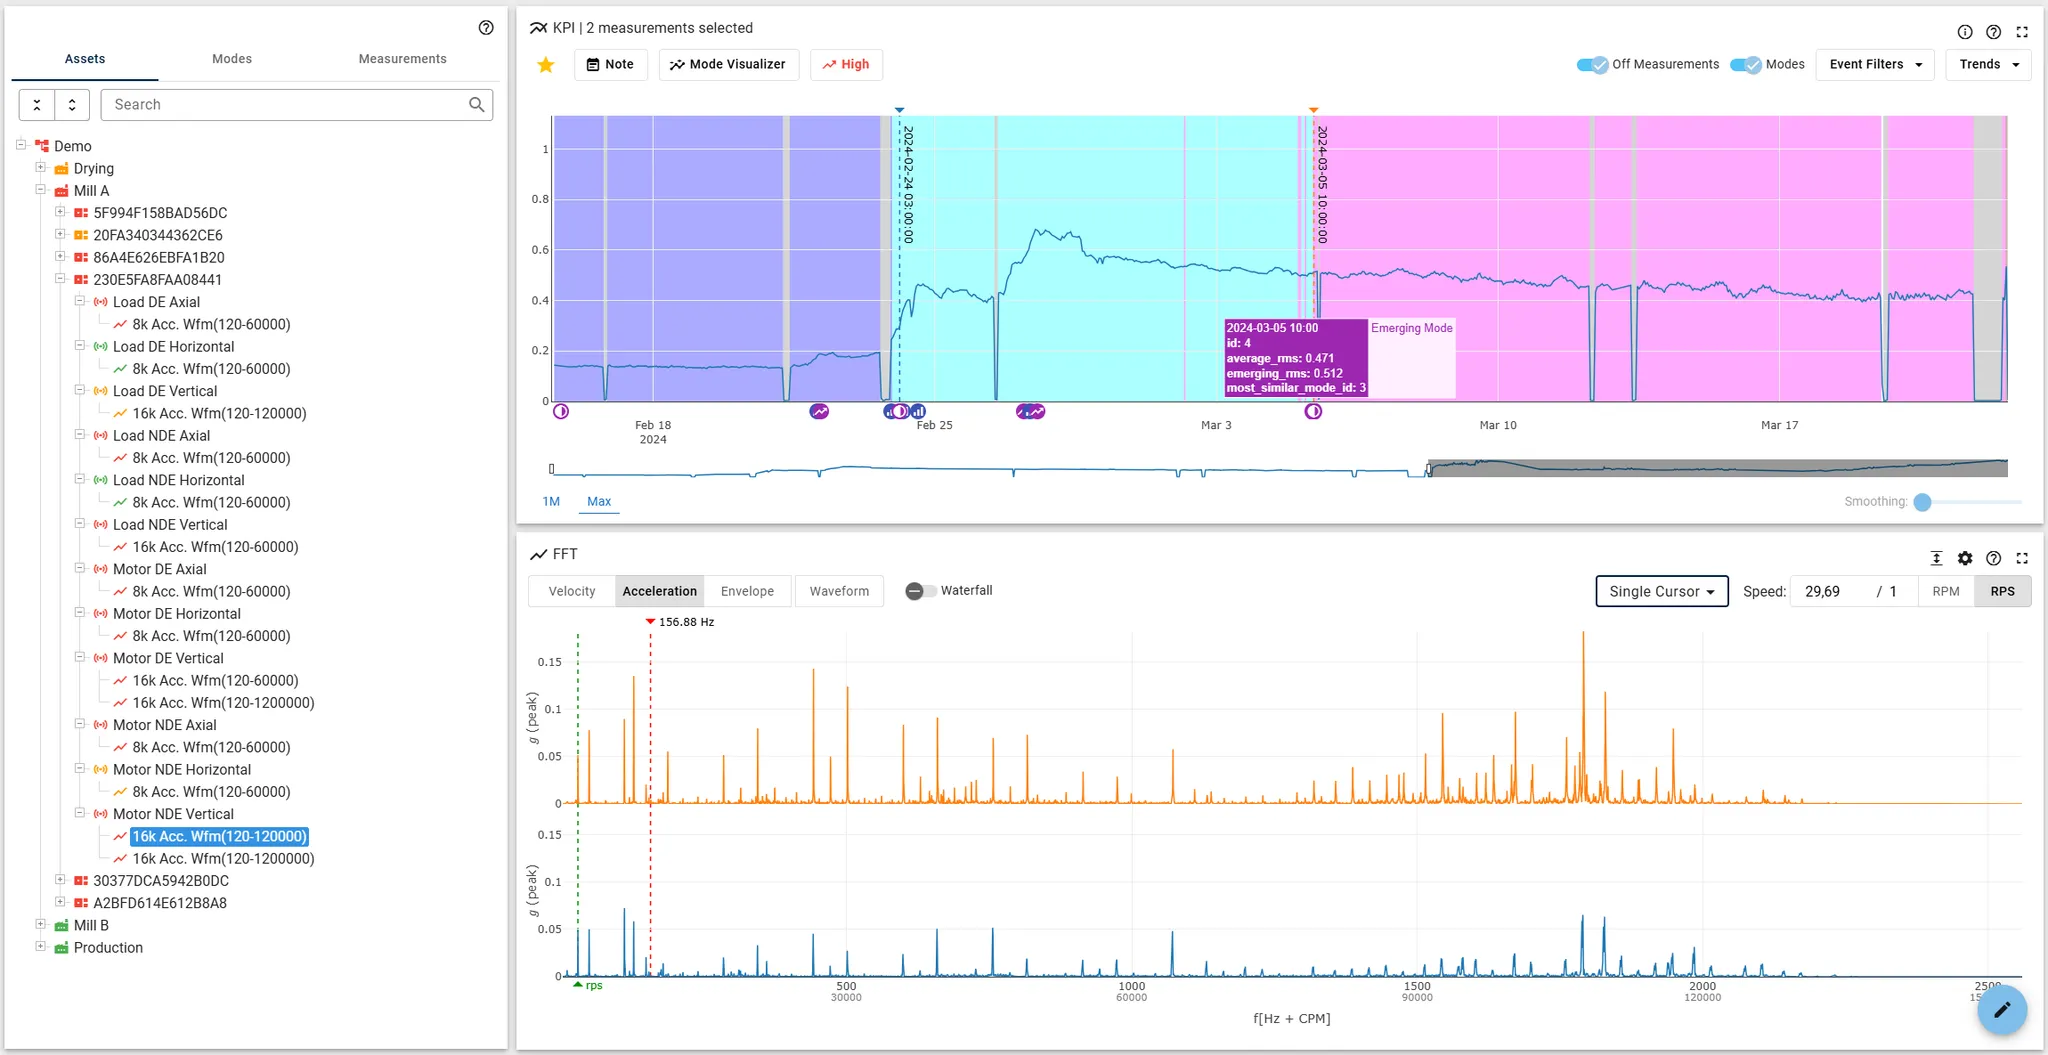
2. Enable Modes and Events for More Insight
When we turn on the modes and events features, we begin to see more activity — especially related to high-frequency events.
Grey indicates no modes, so we see two different machine behaviors (purple and light blue, also identified by the “Emerging Mode” icon).
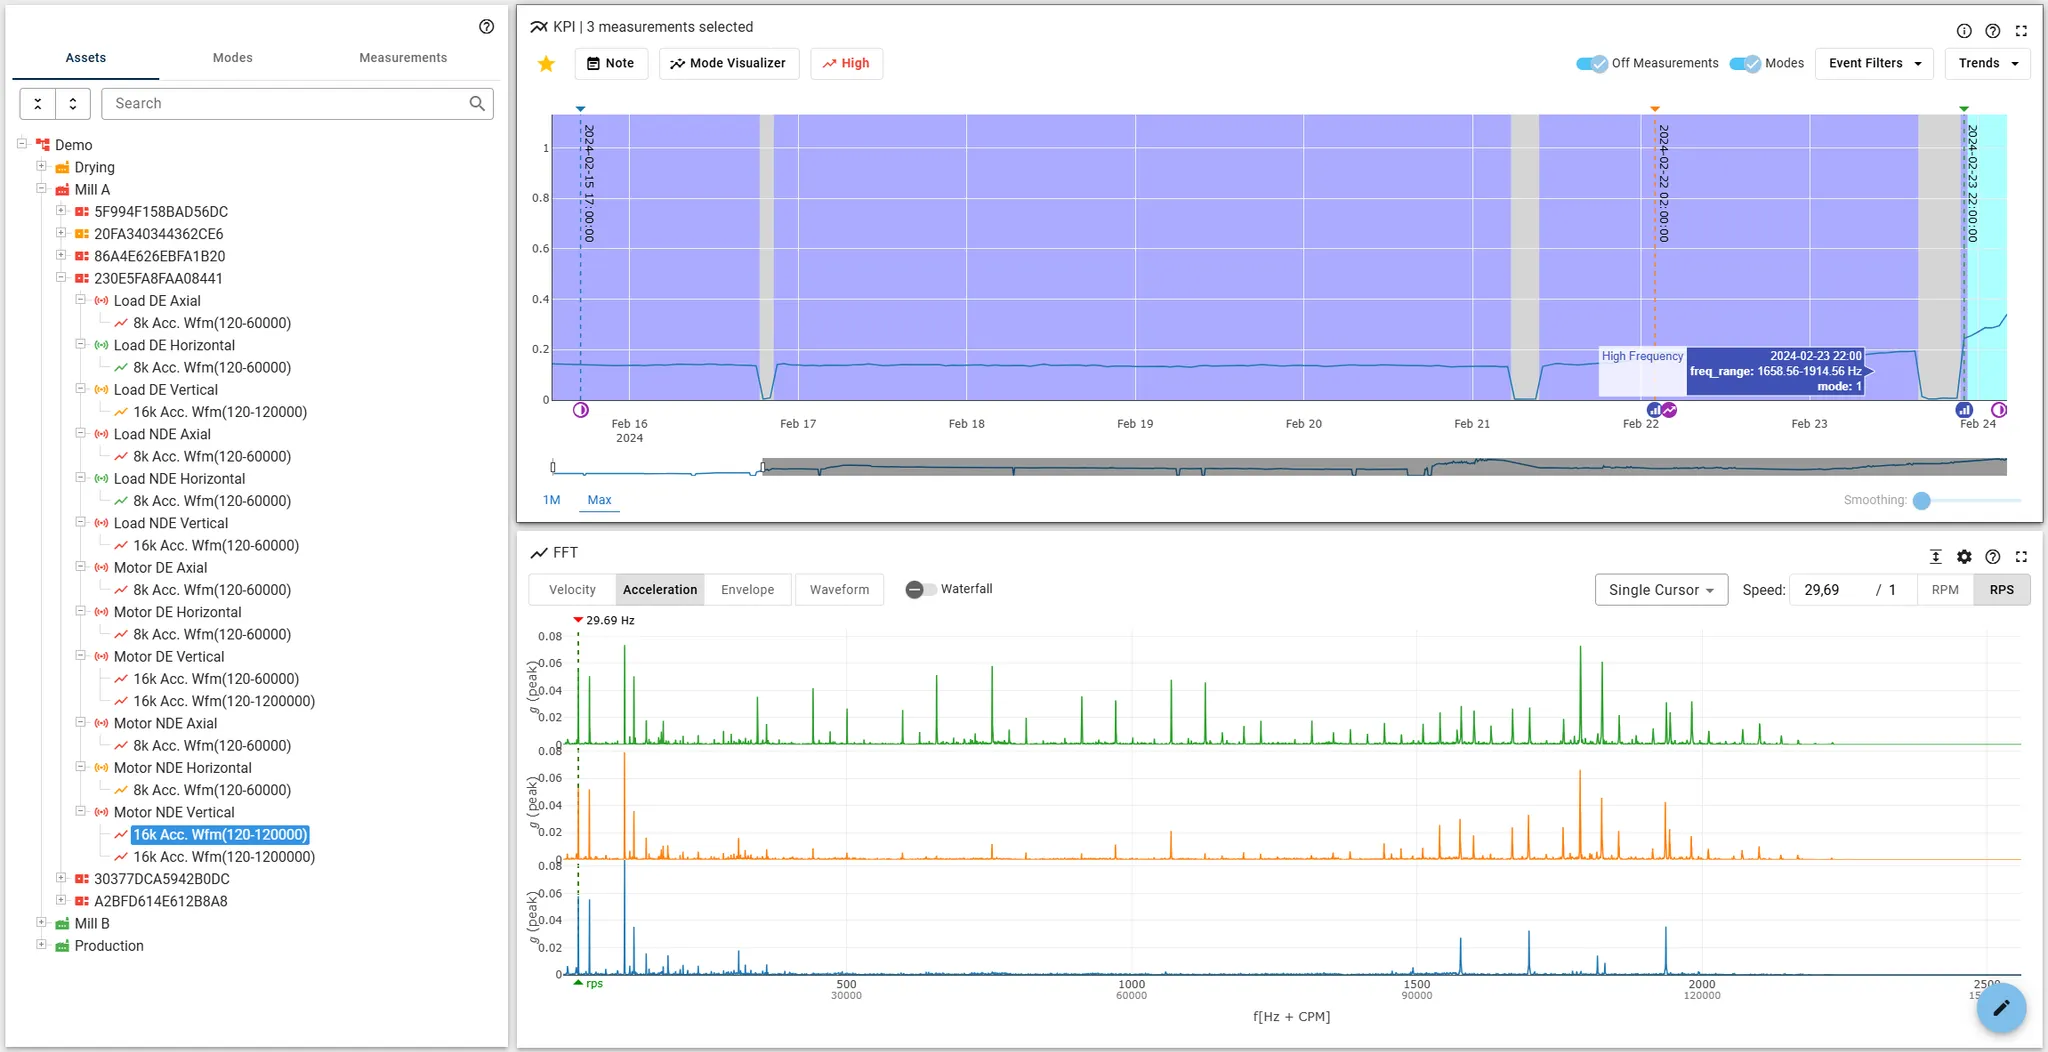
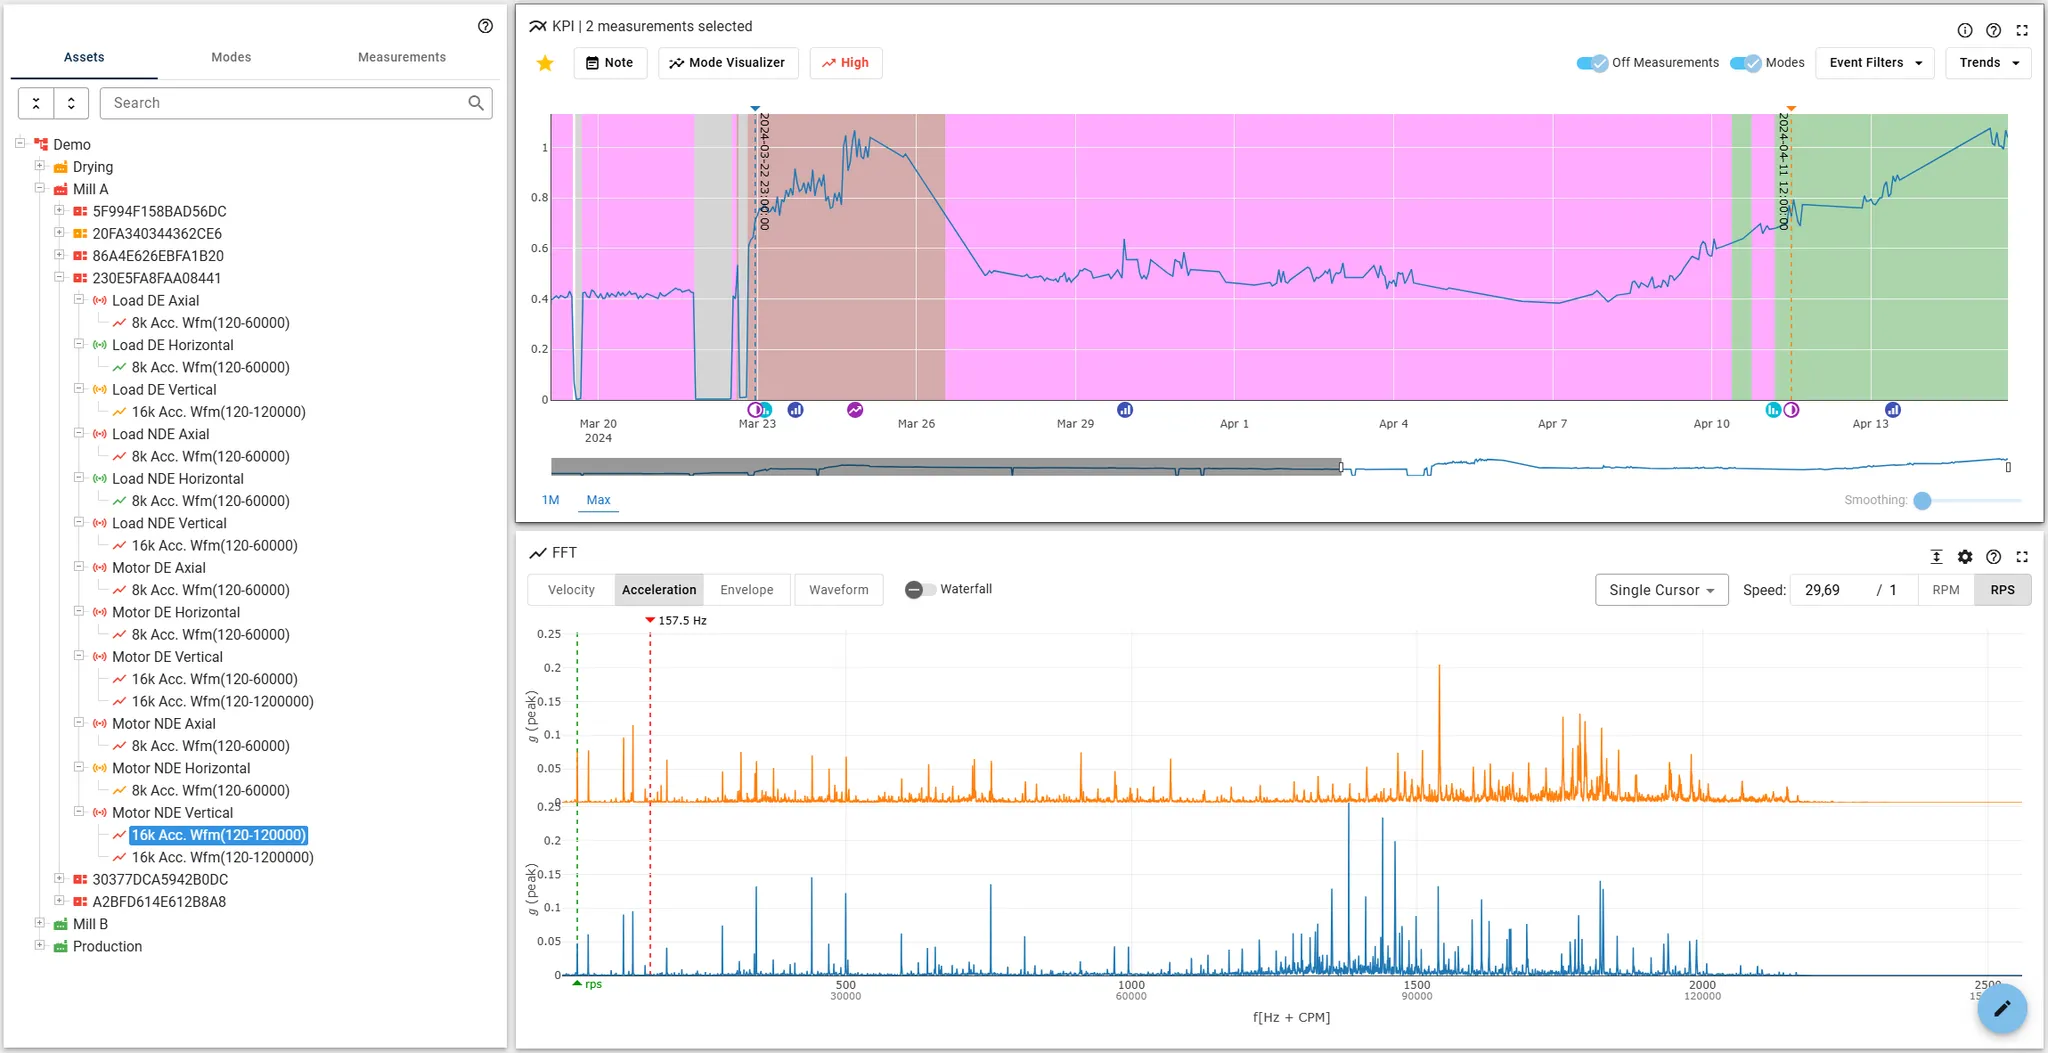
3. Compare Baseline and High-Event Measurements
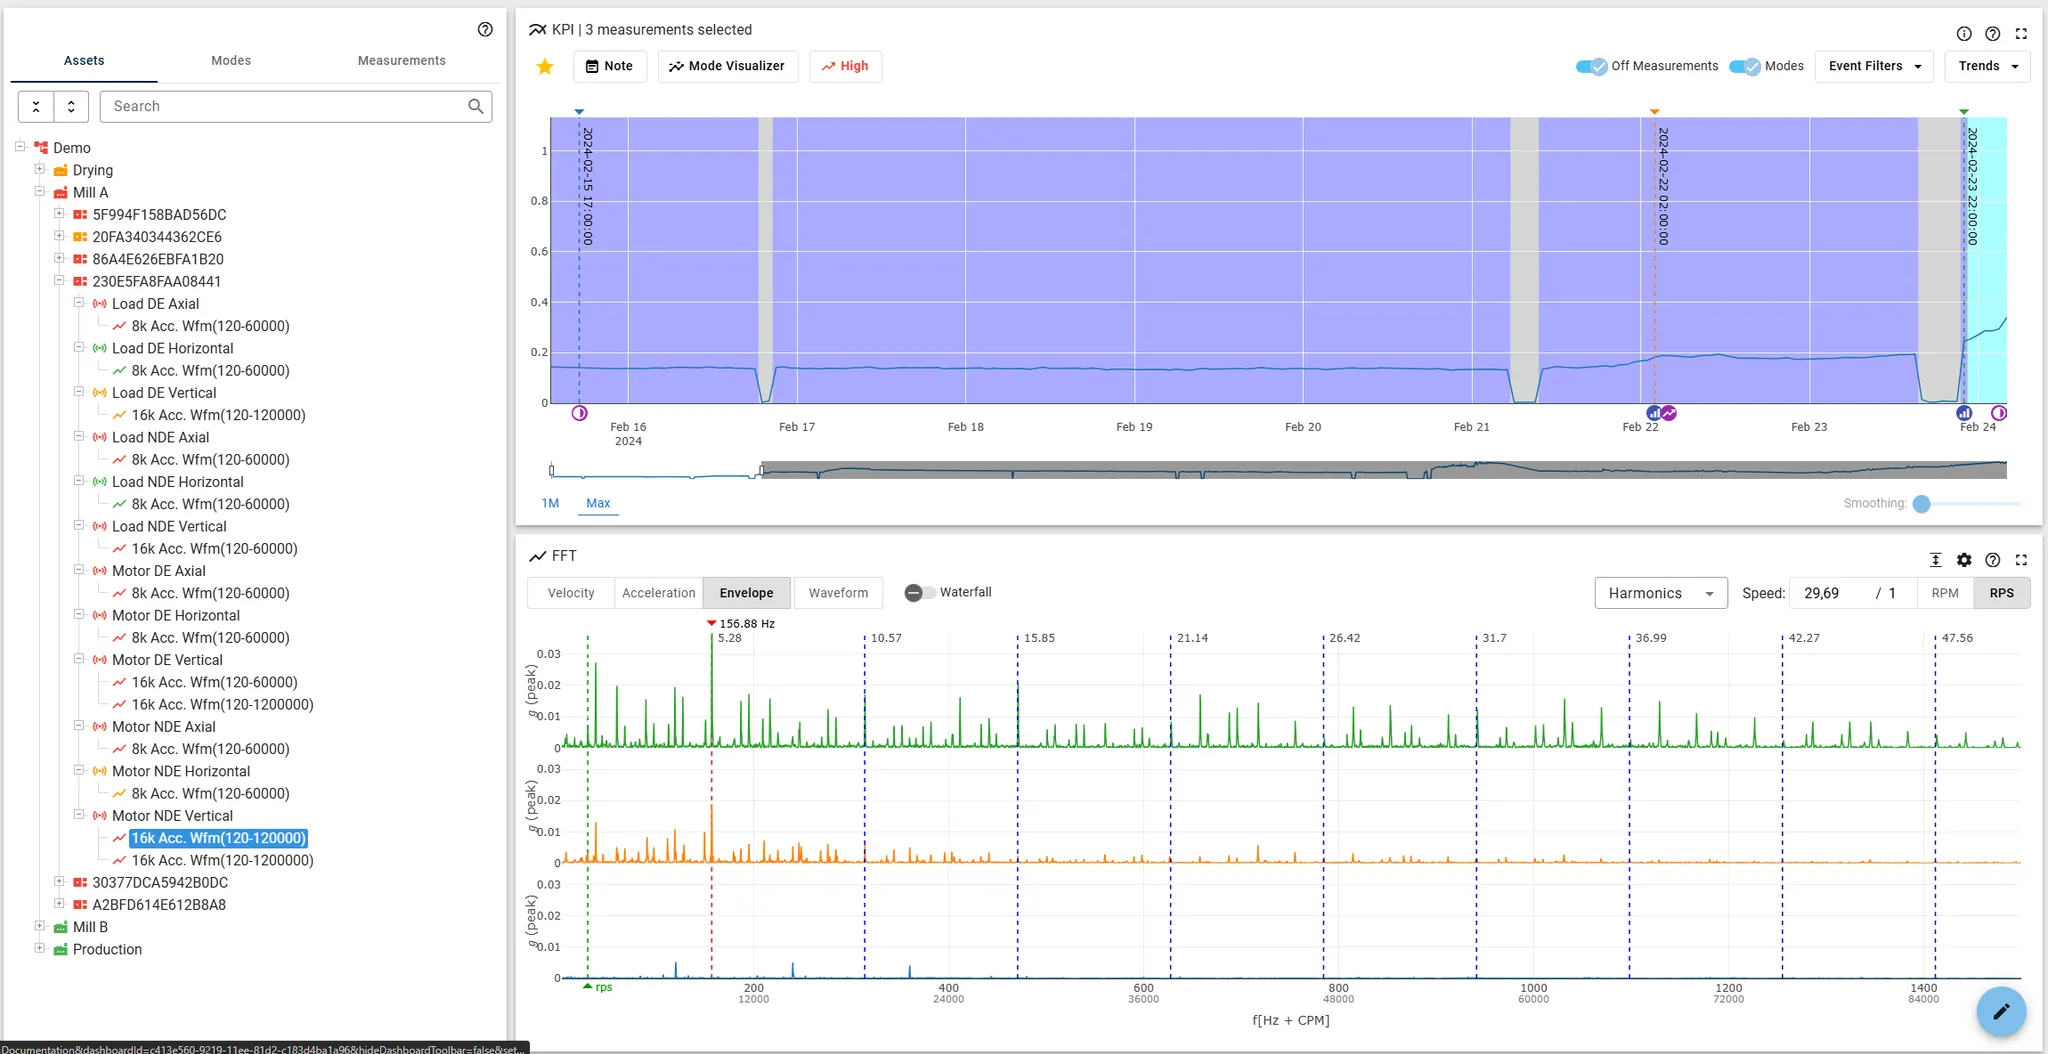
Next, we compare an early measurement within a mode to one taken during a period of high-frequency events (in our example, we’re selecting the first mode, from Feb 15th, to then add the high frequency events of Feb 22nd and Feb 23rd).
- Initially, the spectrum is relatively clean:
- Later, we see multiple new peaks emerging in the high-frequency range:
Given that the machine speed is 30 Hz, these new peaks — particularly in higher frequencies — are signs of abnormal mechanical activity.

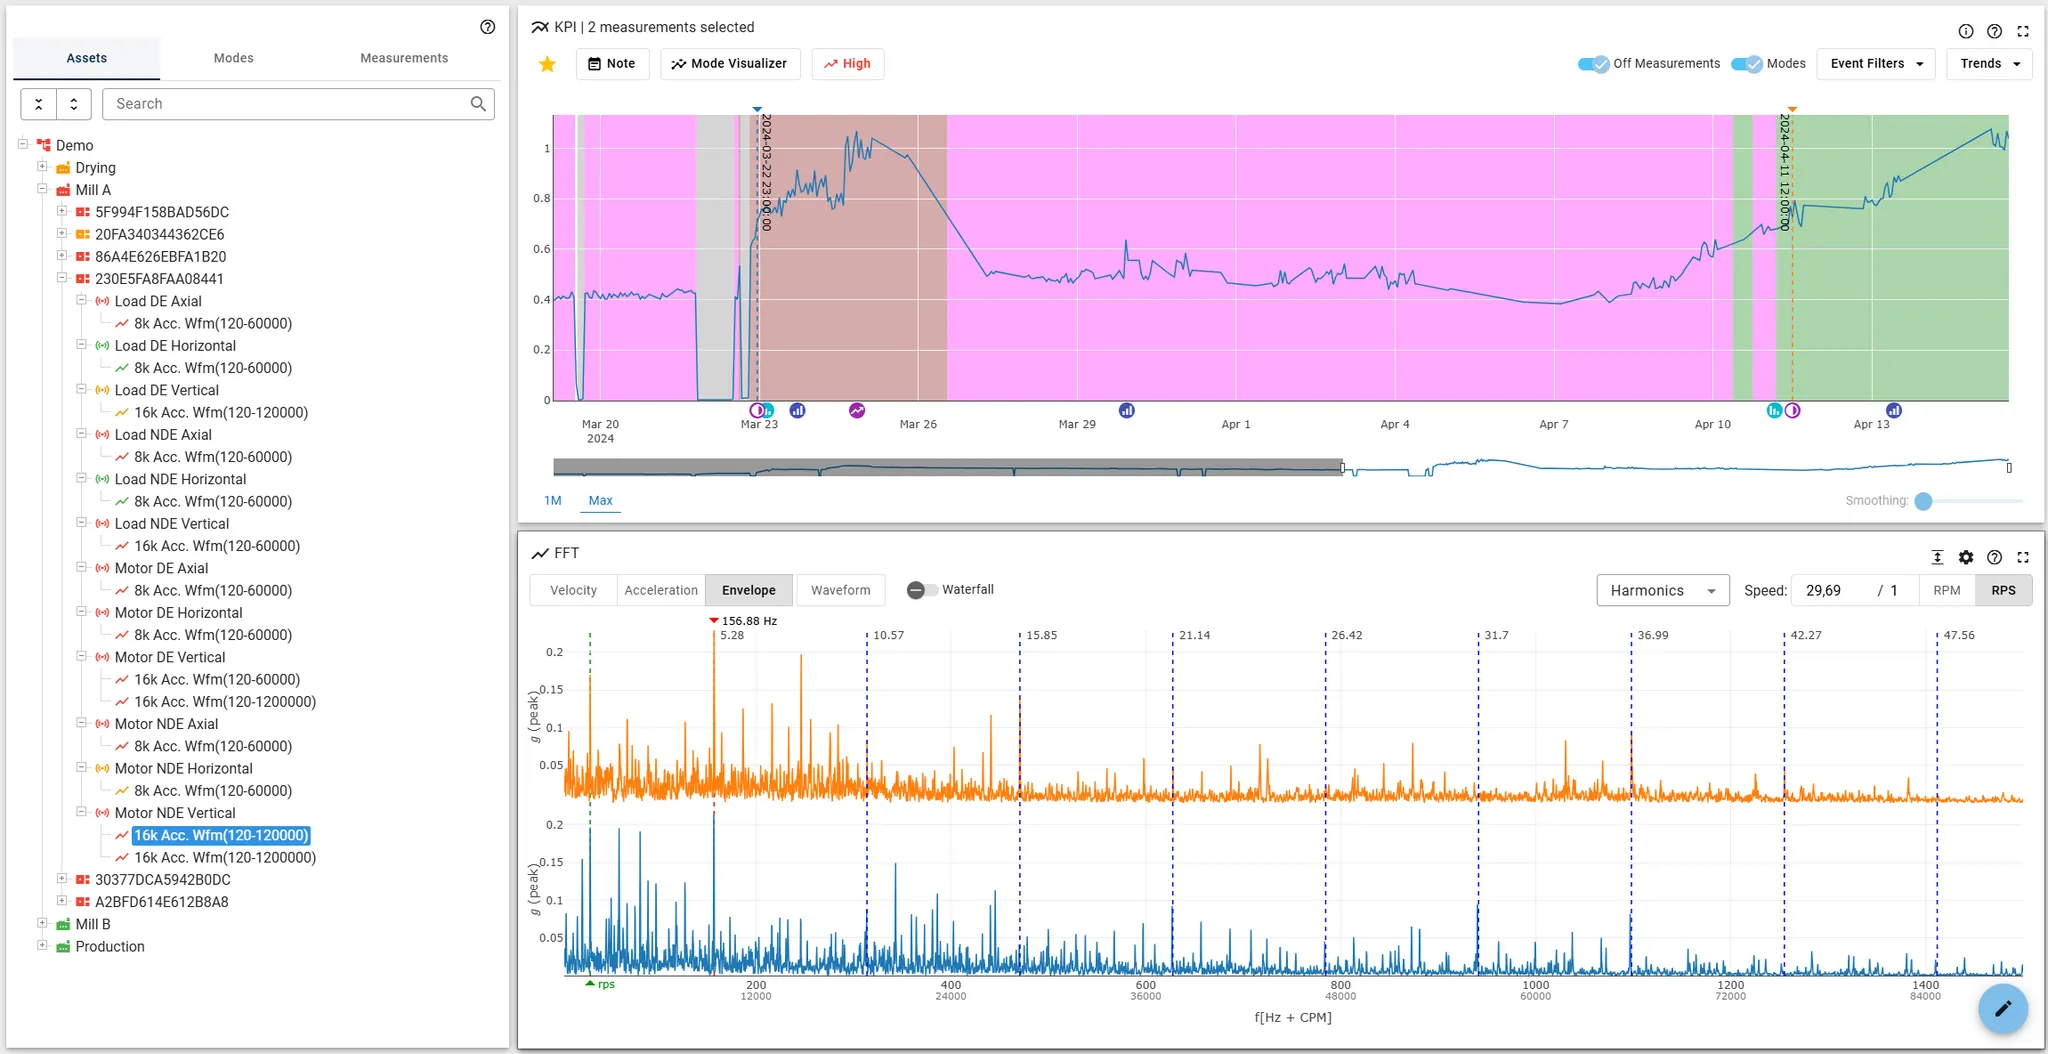
4. Use Envelope Spectrum to Identify Harmonics
Switching to the envelope spectrum, we now see a prominent peak along with several harmonics.
- The key detail: the fundamental frequency is not synchronous with the machine speed.
- This pattern — an asynchronous harmonic family — is a strong indicator of a bearing fault, likely affecting the inner or outer race.
5. Monitor How the Fault Evolves Over Time
By comparing two modes over time:
- The second mode shows significantly more and higher peaks than the first:
- Within a specific mode (e.g., light blue), the peaks increase steadily — a sign of growing damage:
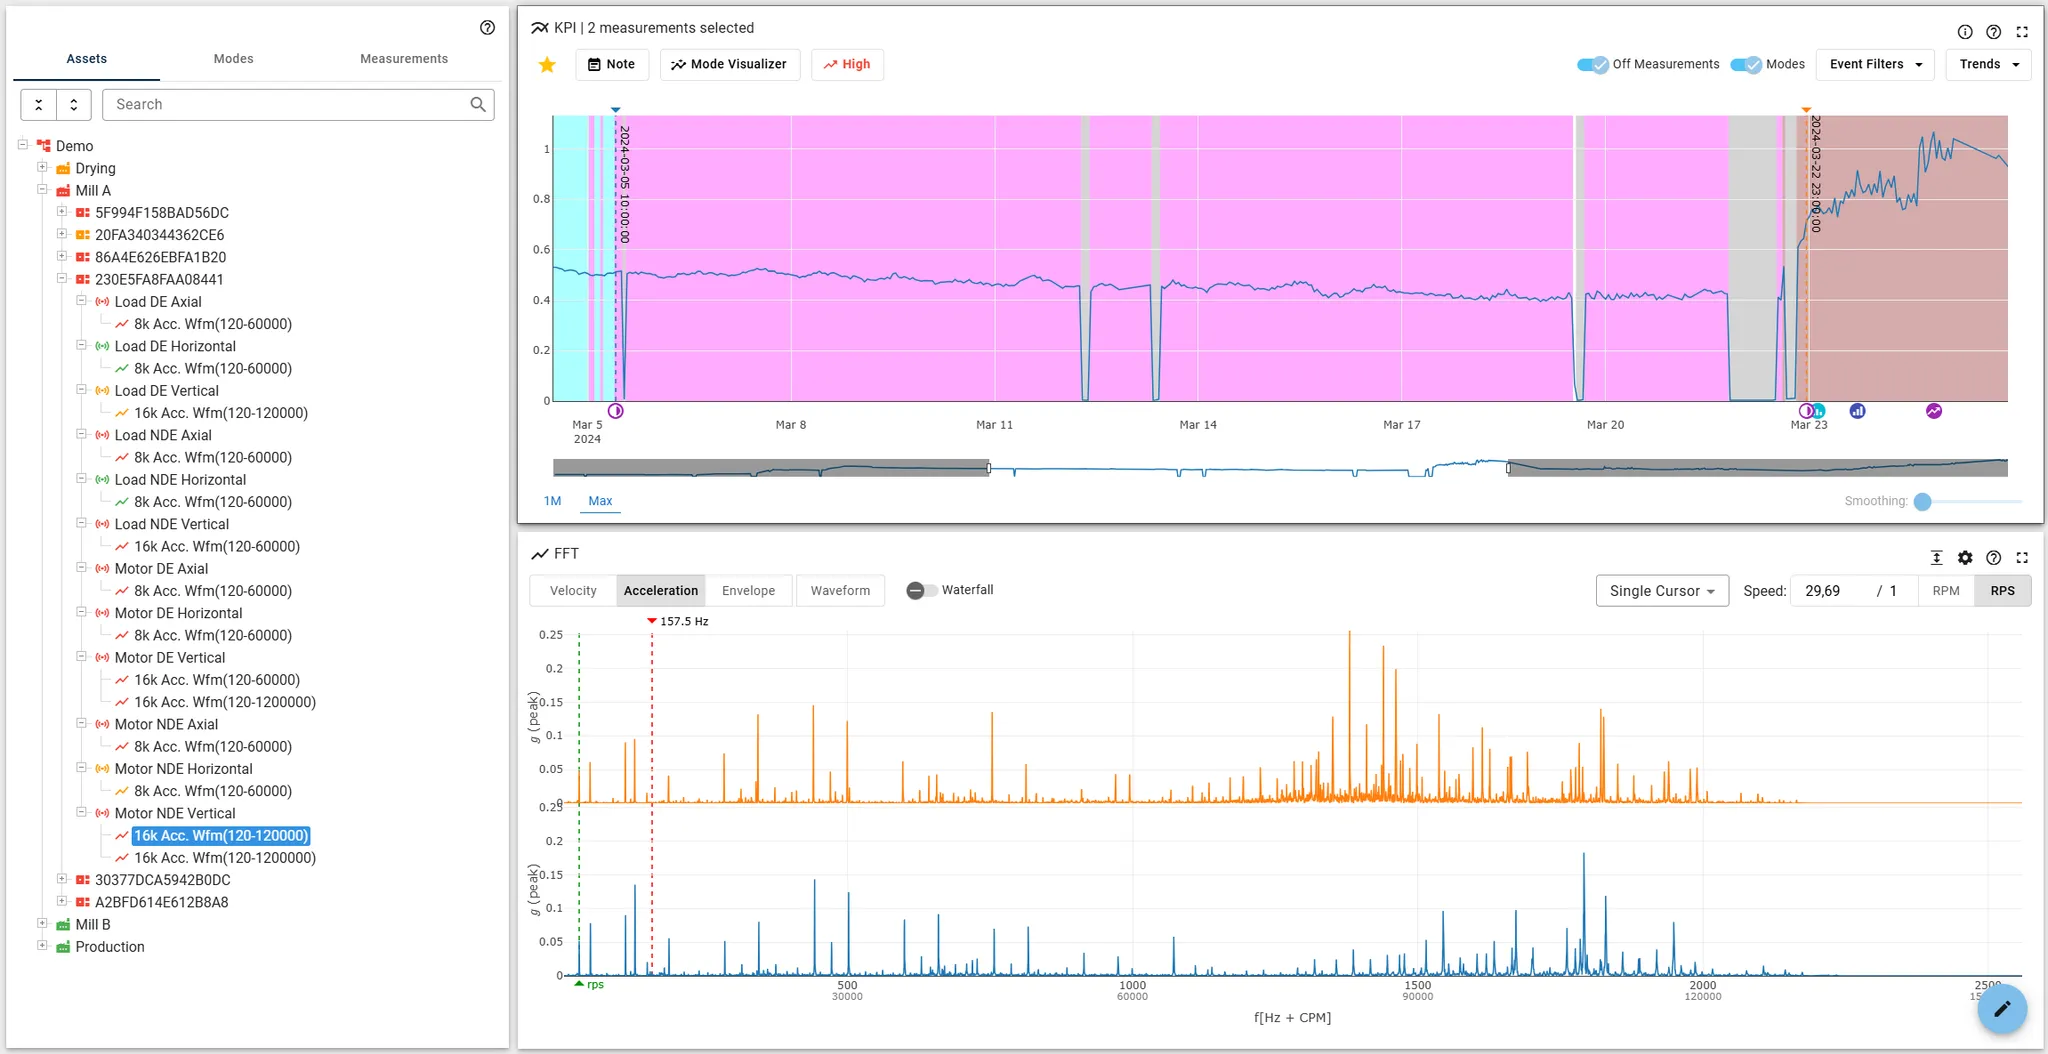
Eventually, the fundamental frequency rises sharply:


6. Lower Frequencies Begin to Show Impact
As damage progresses, peaks begin appearing even in the lower frequency range — suggesting more severe or widespread mechanical impact.
7. Failure Reaches a New Stage
A new mode is triggered when high-frequency noise increases further — another sign that the fault has progressed.
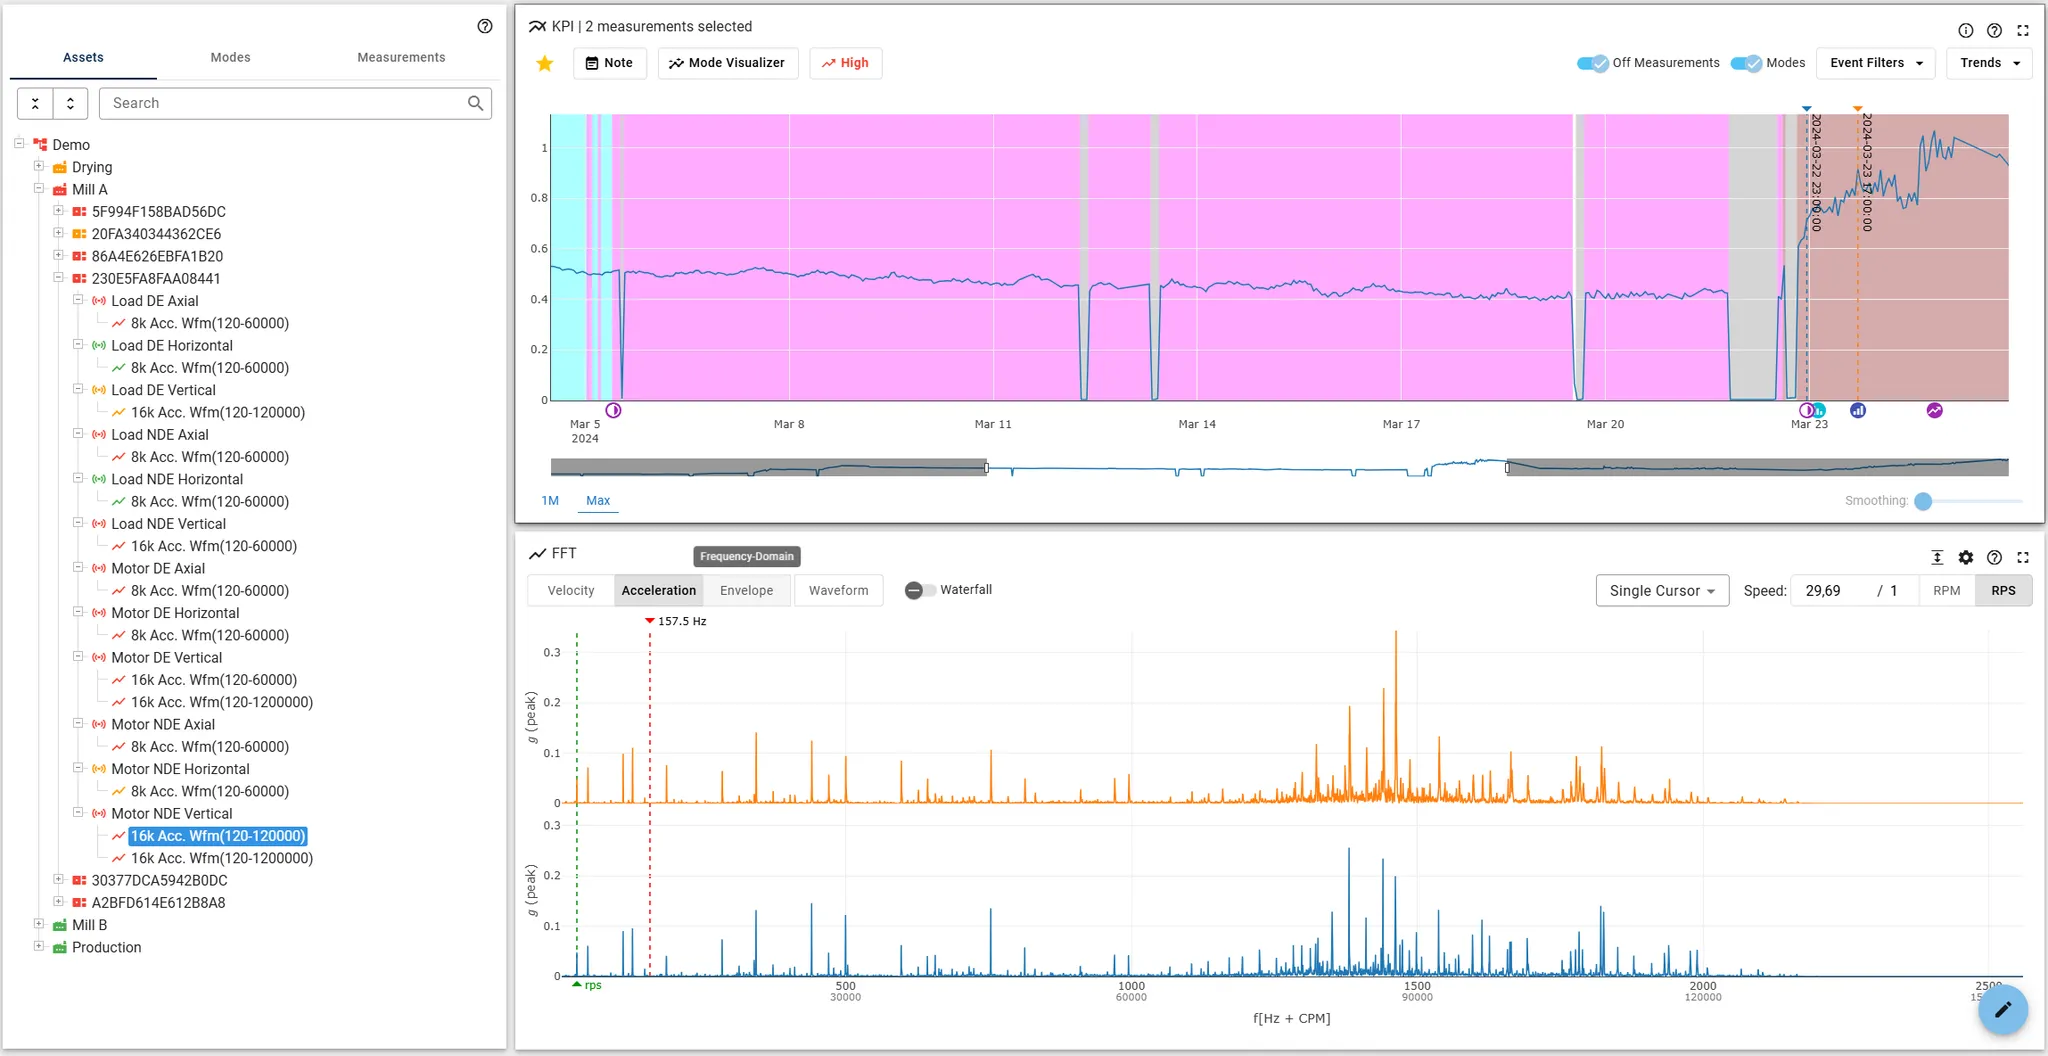
8. Temporary Recovery After Lubrication
At one point, the machine reverts to a previous mode, and the energy in the signal drops — this aligns with a lubrication event that temporarily eased the issue.
Later, however, a new mode is triggered again as high-frequency noise returns:
Despite changes in intensity, the same asynchronous harmonic family remains present, confirming that the underlying bearing fault is still active.
✅ Conclusion
By:
- Tracking trends,
- Using mode-based comparison,
- Looking at envelope harmonics, and
- Observing progression over time,
...we can confidently identify and monitor a bearing fault. The presence of asynchronous harmonics, especially in envelope analysis, is a key diagnostic feature.