
The Customer Overview Page: Your Starting Point
Customer Overview Page: Monitoring All Your Machines
The Customer Overview Page is your central starting point in Multiviz. From here, you can see the full landscape of your machines, sensors, and their current health — all in one place.
Think of it as your daily check-in: What’s stable, what needs attention, and what’s changed?

How It’s Organized
- Sensor Status & Sensor Priority:
Pie charts that give a synthetic overview of all your sensors.
- Factory:
Identify right away which factory or plant you want to monitor.
- Machines & Sensors:
Each machine is shown as a row. Click on it to show its connected sensors grouped beneath. This helps you easily track where each sensor belongs and how everything fits together.
- Status:
This is your expert judgment. You set the status based on your analysis, whether it’s "Normal," "Warning," or "Critical." It’s a human interpretation that stays even if no alerts are active.
- Priority Alert:This column tells you if our algorithms have detected significant behavioral changes, since the last time you cleared.
- If it’s empty, nothing new has changed since your last assessment.
- If it’s red or orange, the system believes something may require your attention.
- Latest Timestamp:
Shows when the most recent data was received. A missing or outdated timestamp could mean a connectivity issue.
- Bookmarking:
Use bookmarks to pin machines you want to keep an eye on.
Sorting and Filtering
You can sort and filter on any column:
- Factory
- Machine
- Status
- Priority Alert
- Latest Timestamp
This makes it easy to focus on just the machines that you wish.
Working Inside the Overview
- Expanding a Row:
Click on any machine to preview its associated data sources (sensors).
💡These are usually grouped by alphabetical order — unless you're using Ronds sensors, which currently group by direction (we're working on this).
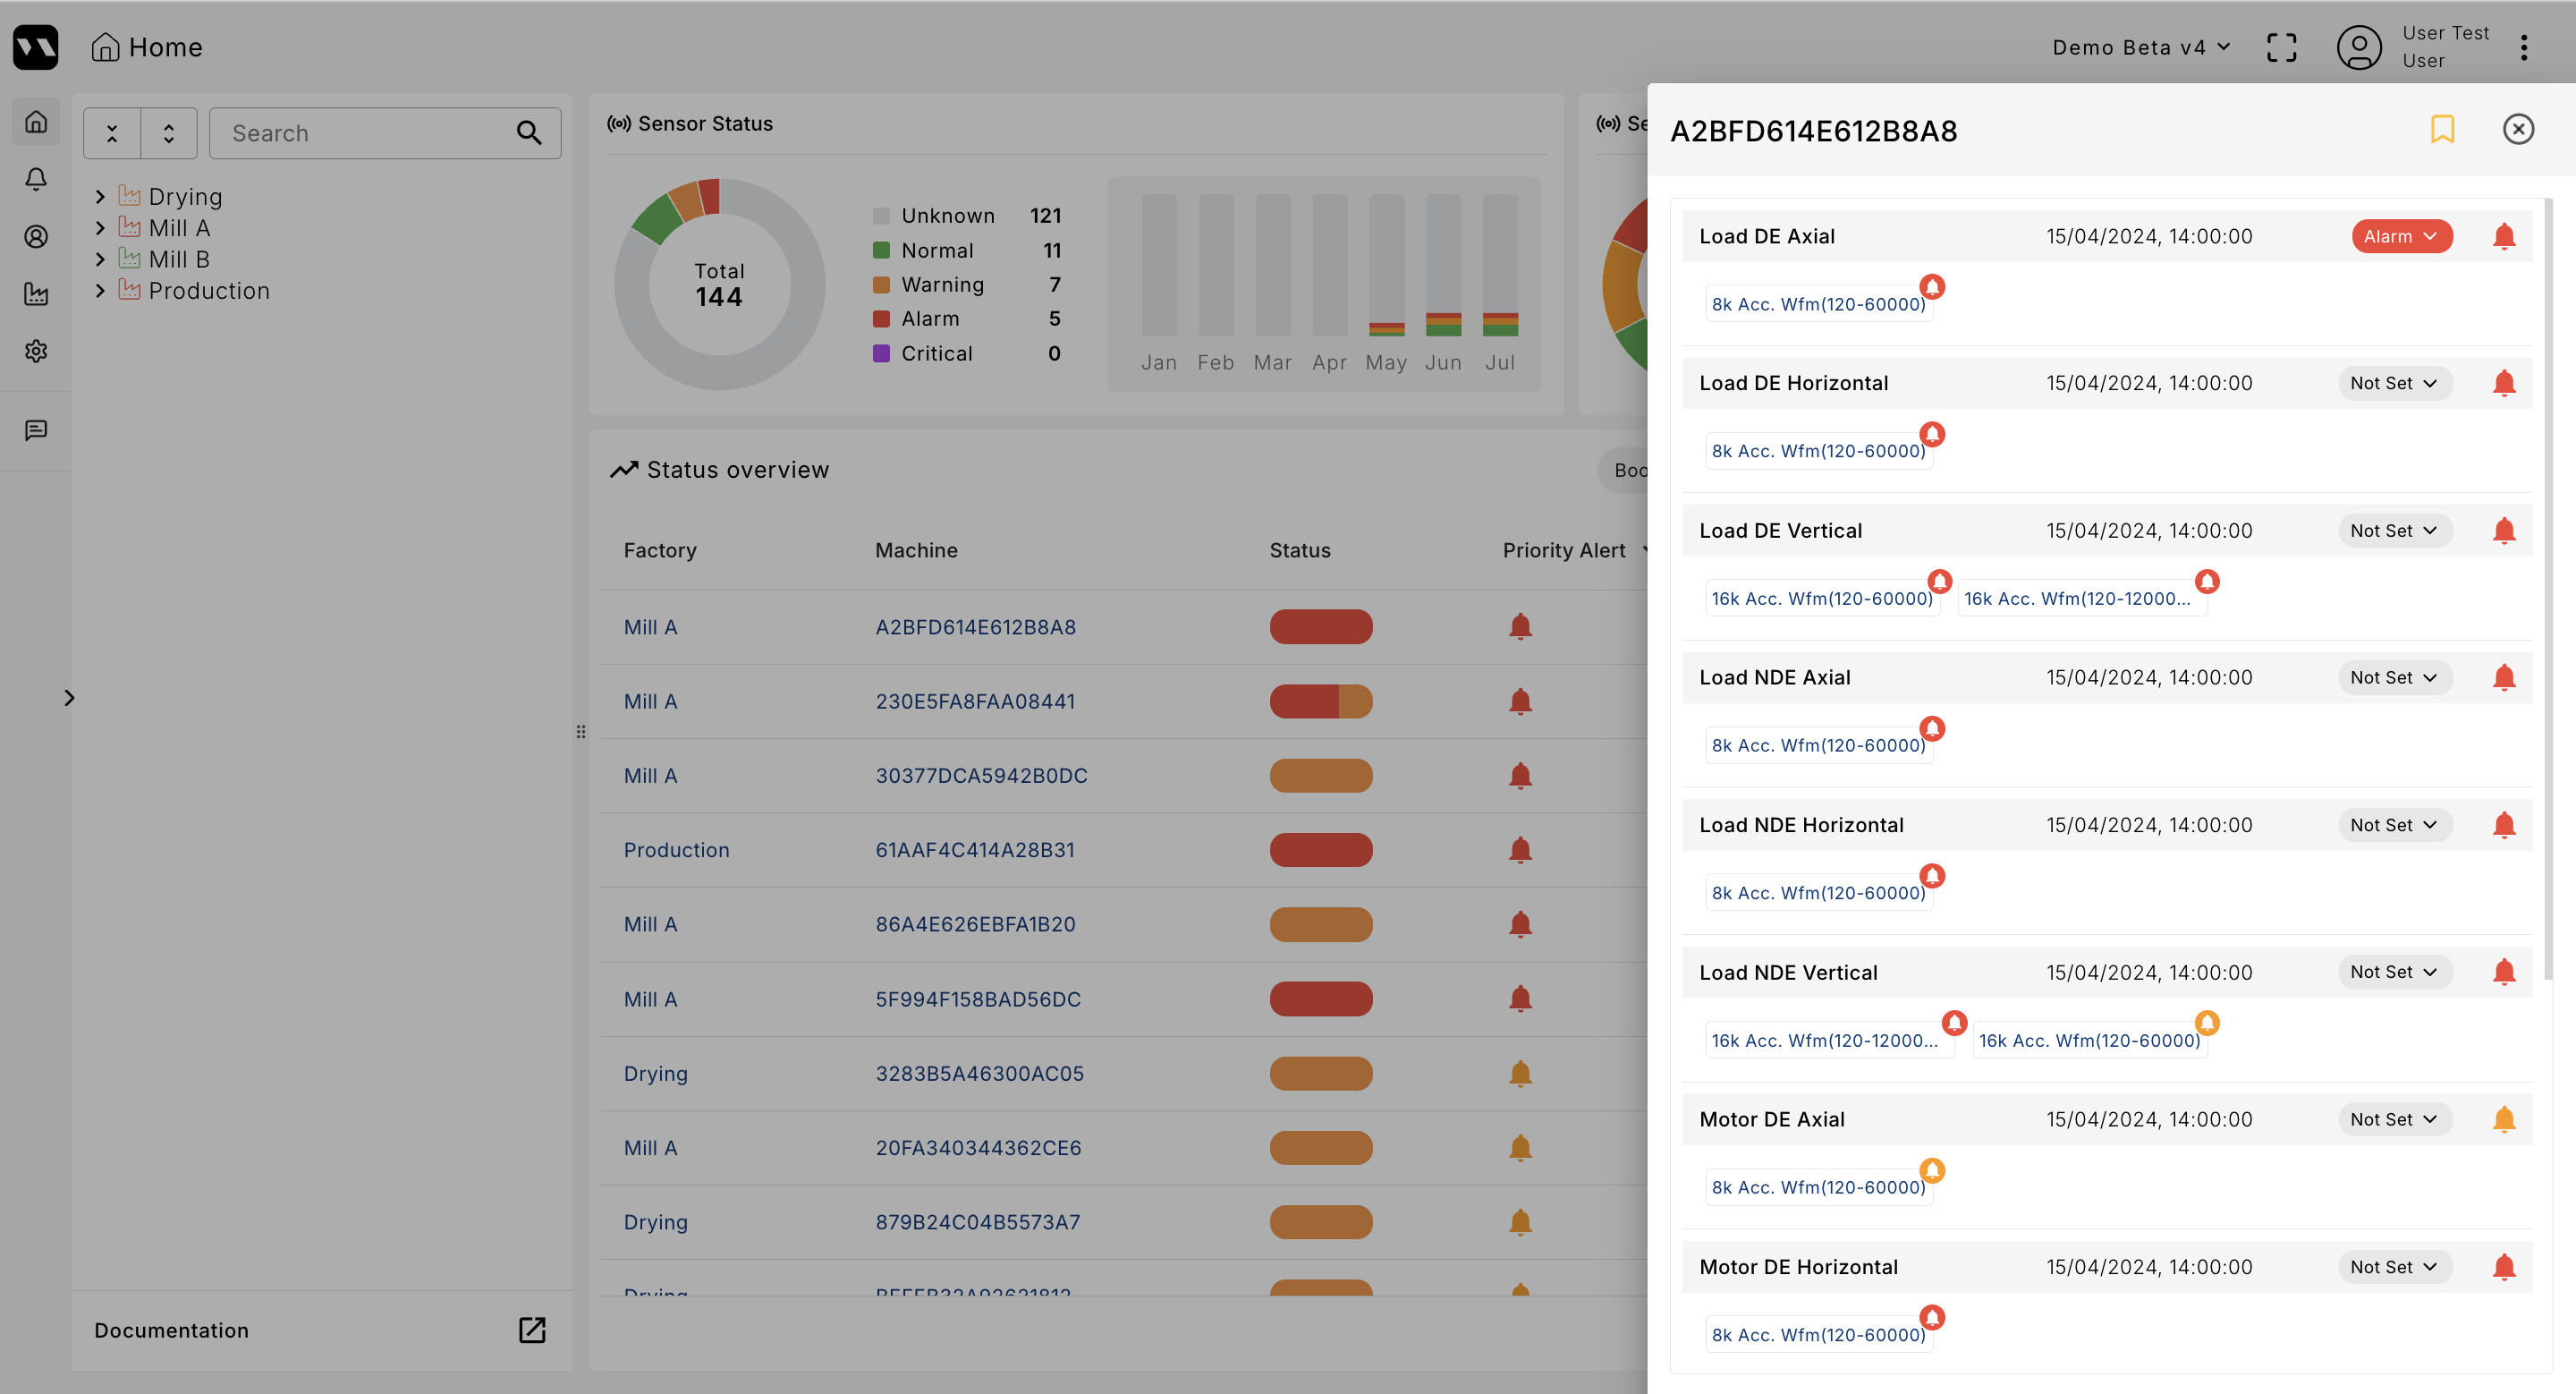
- Updating Status:
To change the machine’s status, just click on the field that contains “Not Set” or the previous status you had selected and select the new value based on your findings.

- Going Deeper:
Click the name of any data source to open the Deep Analysis View, where you can inspect the raw vibration data and trends in detail.