
Signs Your Machine Is Running Smoothly
There’s no one-size-fits-all answer to the question “What does a healthy machine look like?” Machines vary widely — from small fans running at a few hundred RPM to massive industrial equipment operating at high frequencies. What’s normal depends on the context.
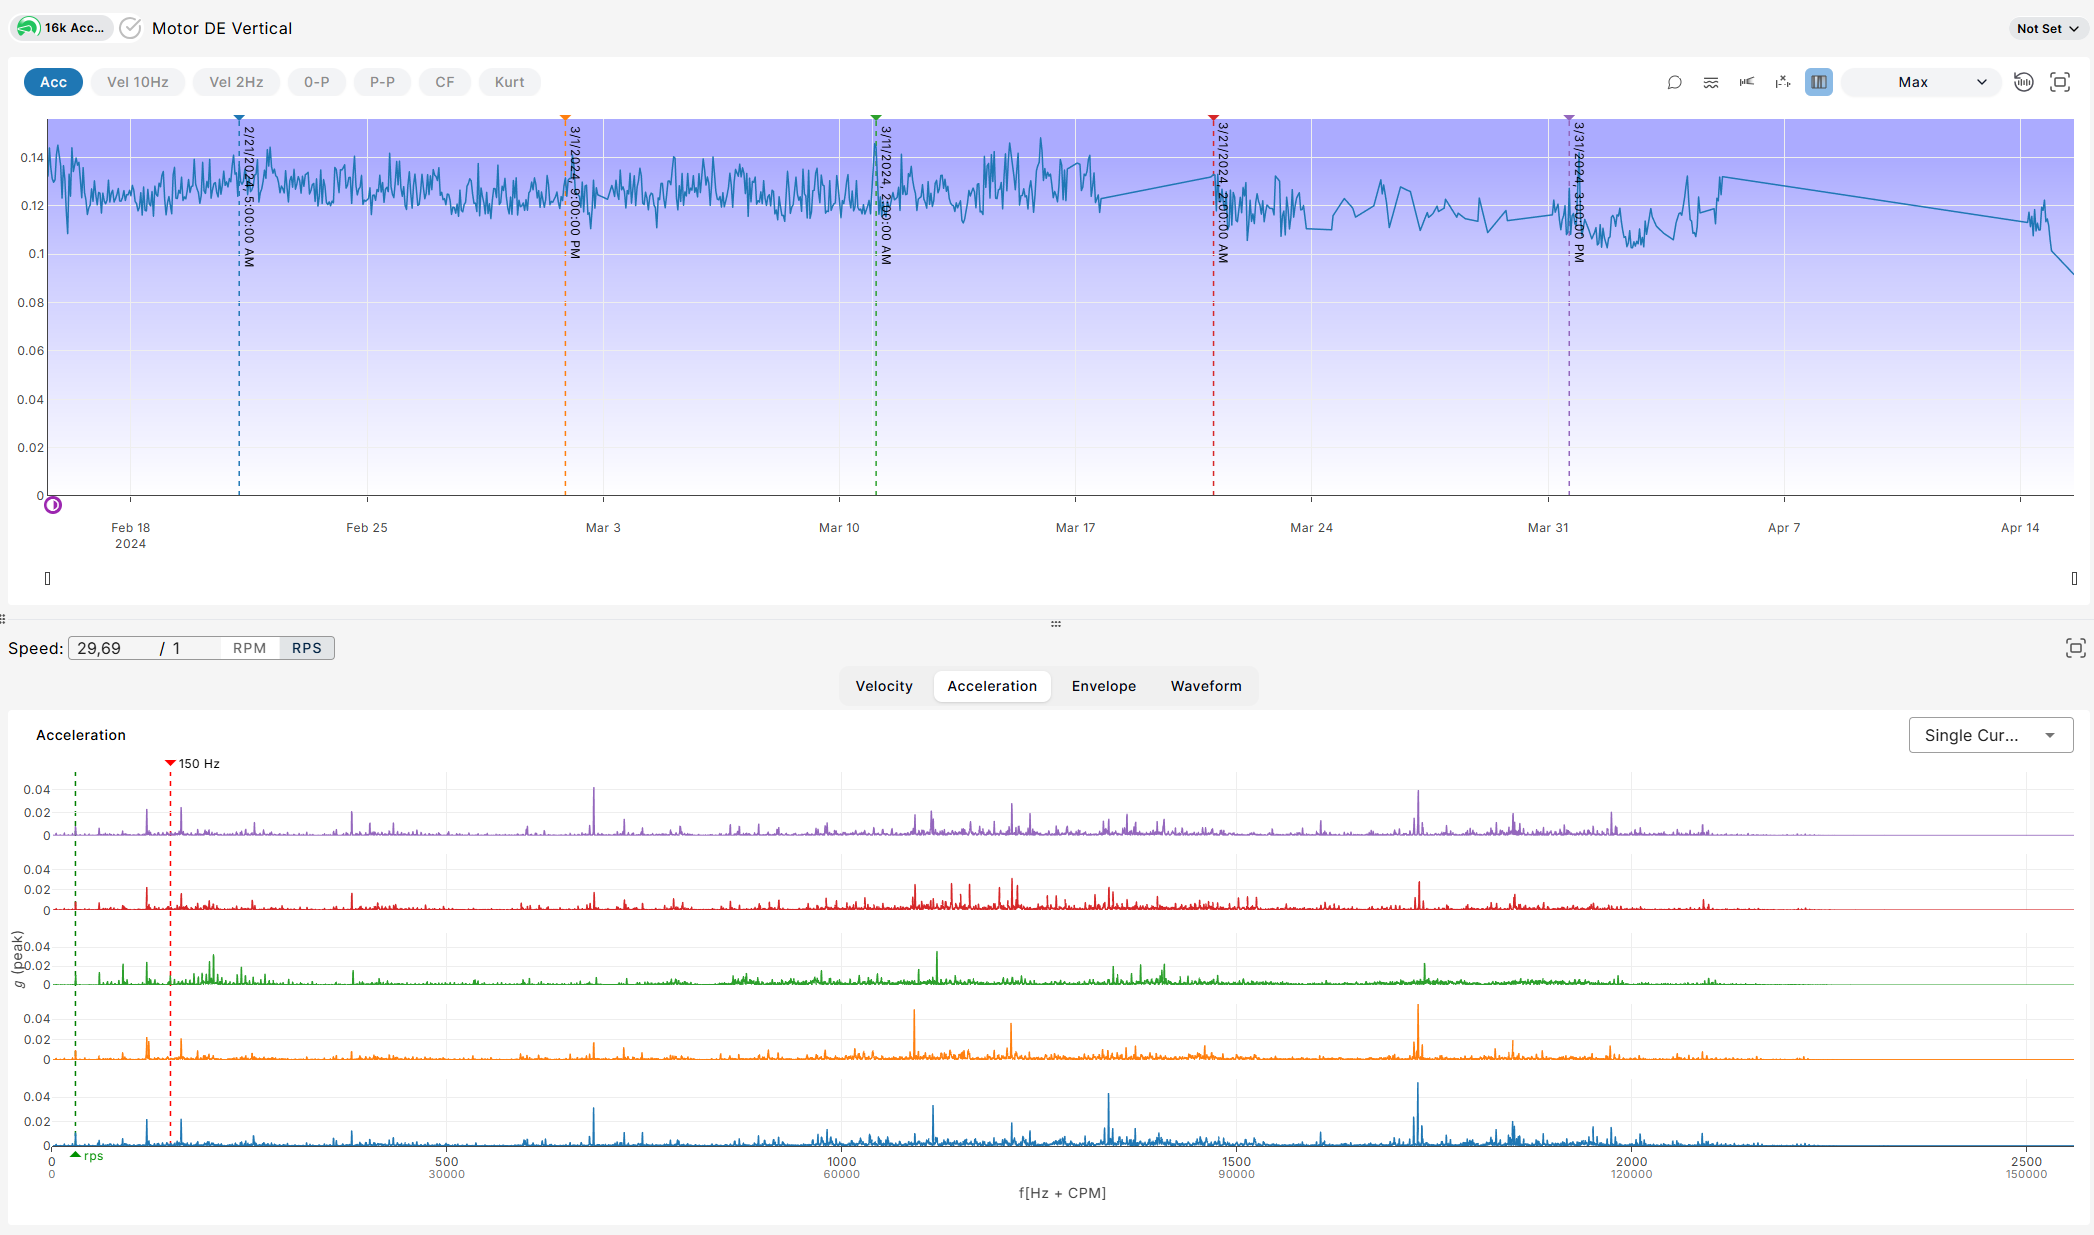
Stability Is a Good Sign
While machines can behave very differently, a stable signal is usually a healthy signal. That means both your trend data and your spectrum should remain consistent over time. If your machine stays within just one or a few modes for long stretches — that’s typically a sign that things are running smoothly.
When a machine starts to experience issues, you’ll often see changes in the spectrum first, followed by rising values in the trend.
In the image below, for example, you can clearly see that both the trend plot and the spectra of various measurements within that mode look quite similar.
What About Thresholds?
MultiViz doesn’t rely on static thresholds — we use data-driven models based on modes. This helps avoid unnecessary alerts. That said, you’ll still see shifts in RMS and frequency content flagged as events when something deviates significantly from the machine’s usual patterns. These shifts can be early indicators of developing faults — so the thresholds are dynamic, not fixed, and tailored to the actual behavior of your machine.