November Improvements Roundup
Head into the holidays with a clearer MultiViz.
As Q4 wraps up, we’ve focused on improvements that remove friction, save clicks, and help your team move faster—so you can spend December thinking about production, not platform quirks.
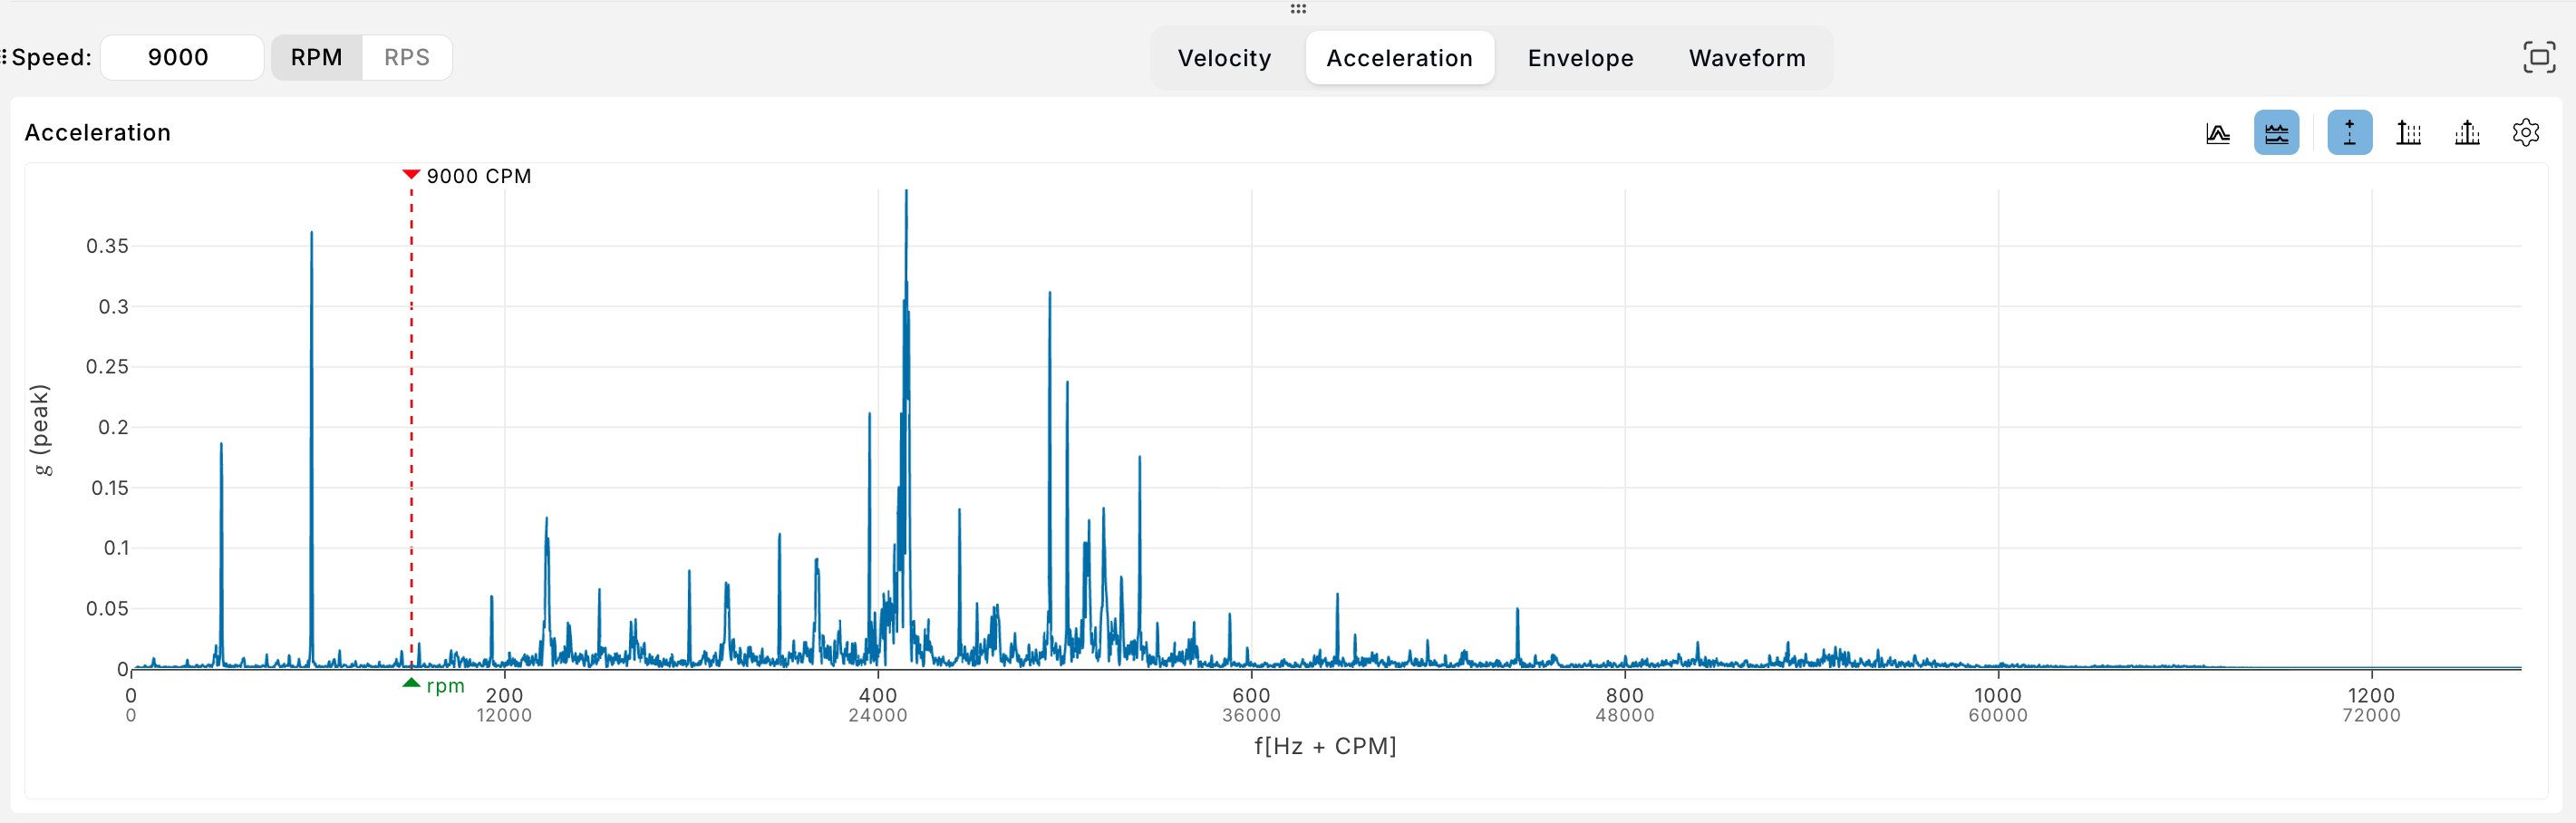
1. More room for analytics (cleaner header layout)
We’ve condensed the header above the plot from two lines into one, giving you more vertical space for analysis and an overall cleaner interface.
A small visual change—big win for usability.
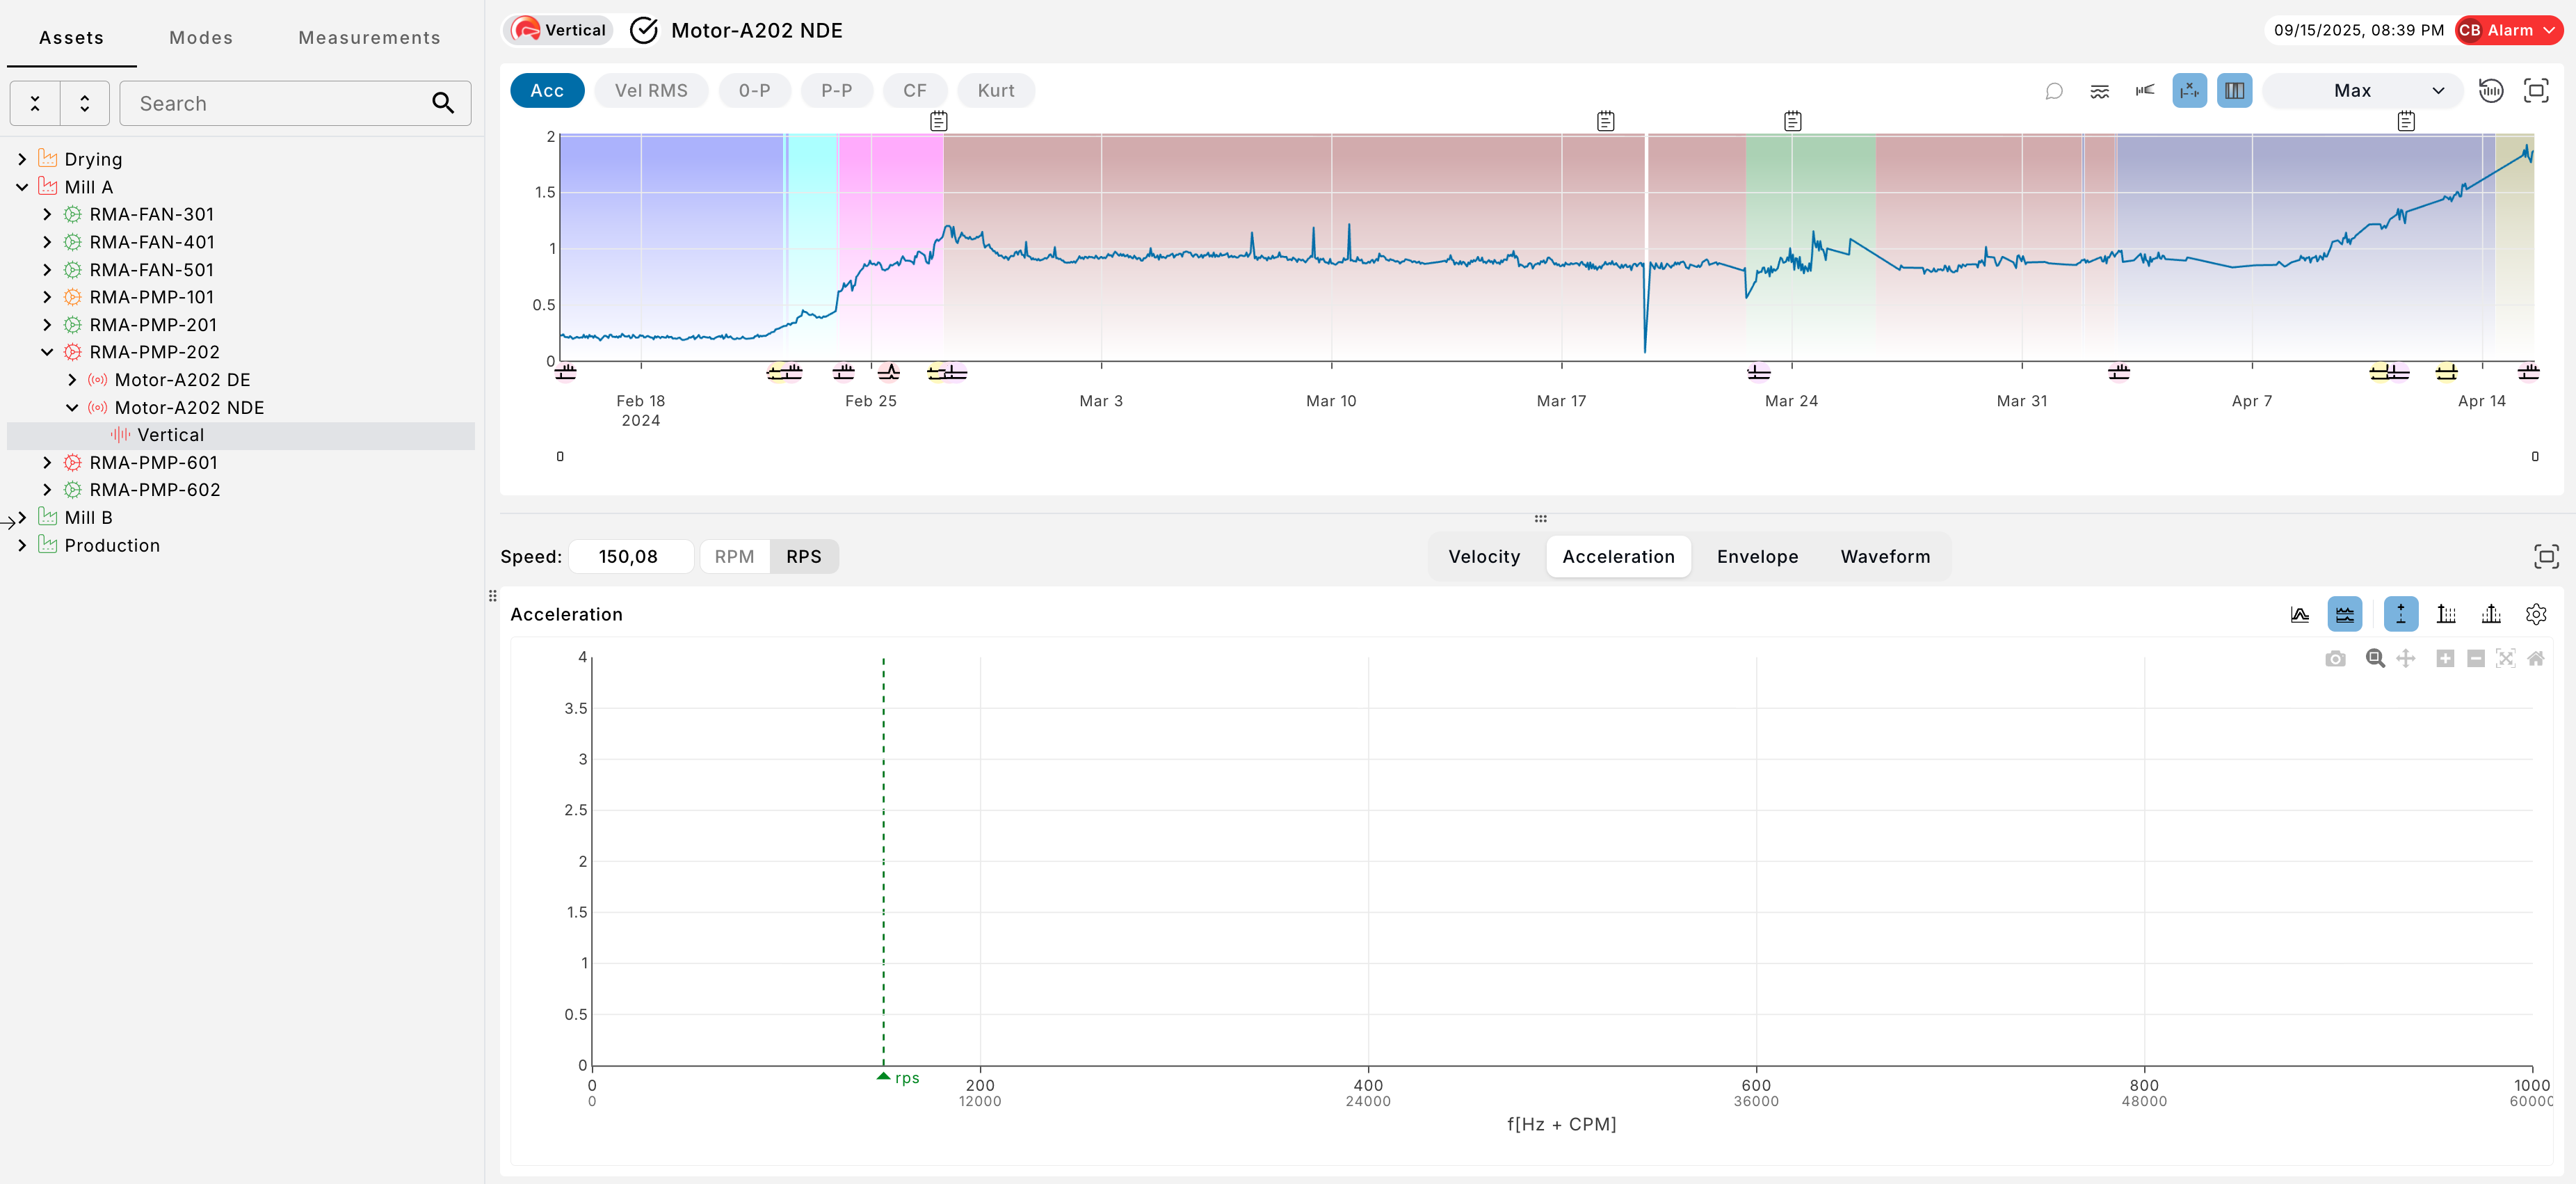
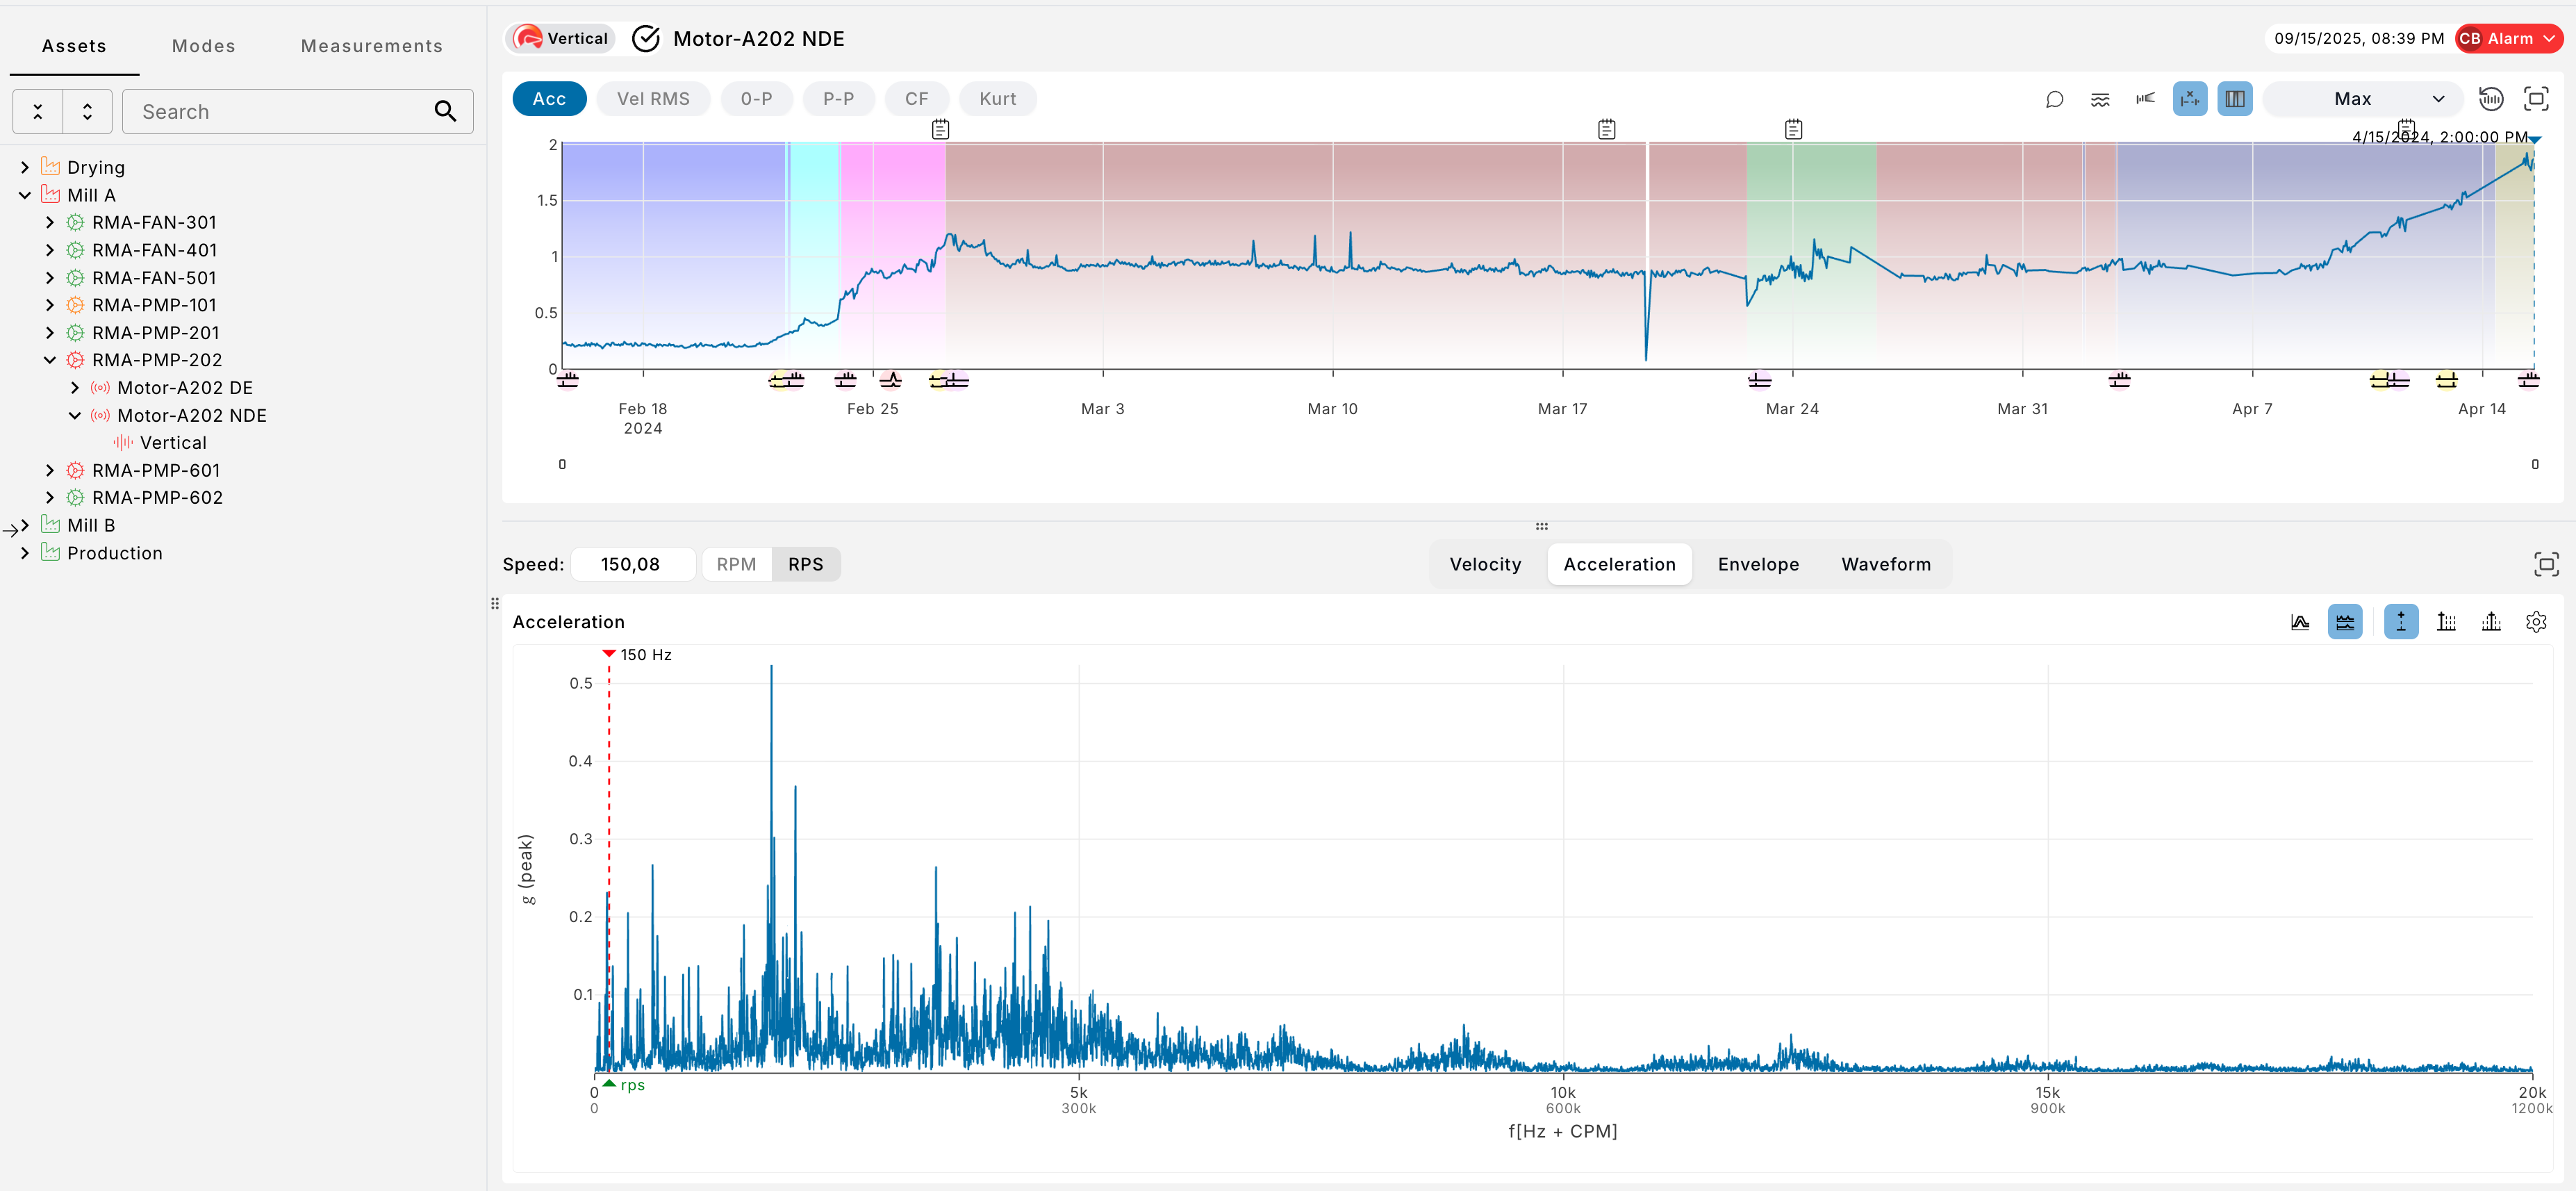
2. Latest measurement auto-selected
When you open a sourced asset, MultiViz now automatically highlights the most recent measurement.
No more empty screens or extra clicks. You land straight where you need to be.
Before:
After:
3. Smarter anomaly prioritization
The anomaly engine now recognizes when multiple anomalies occur within a short time window.
Single anomalies won’t suddenly spike priority, but clusters will—giving you a more accurate view of what truly needs attention before year-end shutdowns.
4. Zoom on the Y-axis
In the Spectrum plot you can now click and drag vertically to box zoom on the y-axis for precise amplitude or magnitude control.