
January Improvements Roundup
As we kick off the new year, we’re starting with a set of focused improvements designed to make analysis clearer, faster, and more reliable.
1. Logarithmic Scaling
You can now toggle logarithmic scaling on velocity, acceleration, and envelope charts. This makes it easier to visualize signals with wide dynamic ranges and uncover details that were previously hard to see.
2. Improved Chart Layout
The measurement information box widget has been moved to the corner of the chart. This prevents the information window from obstructing the data, giving you a cleaner and more readable view.
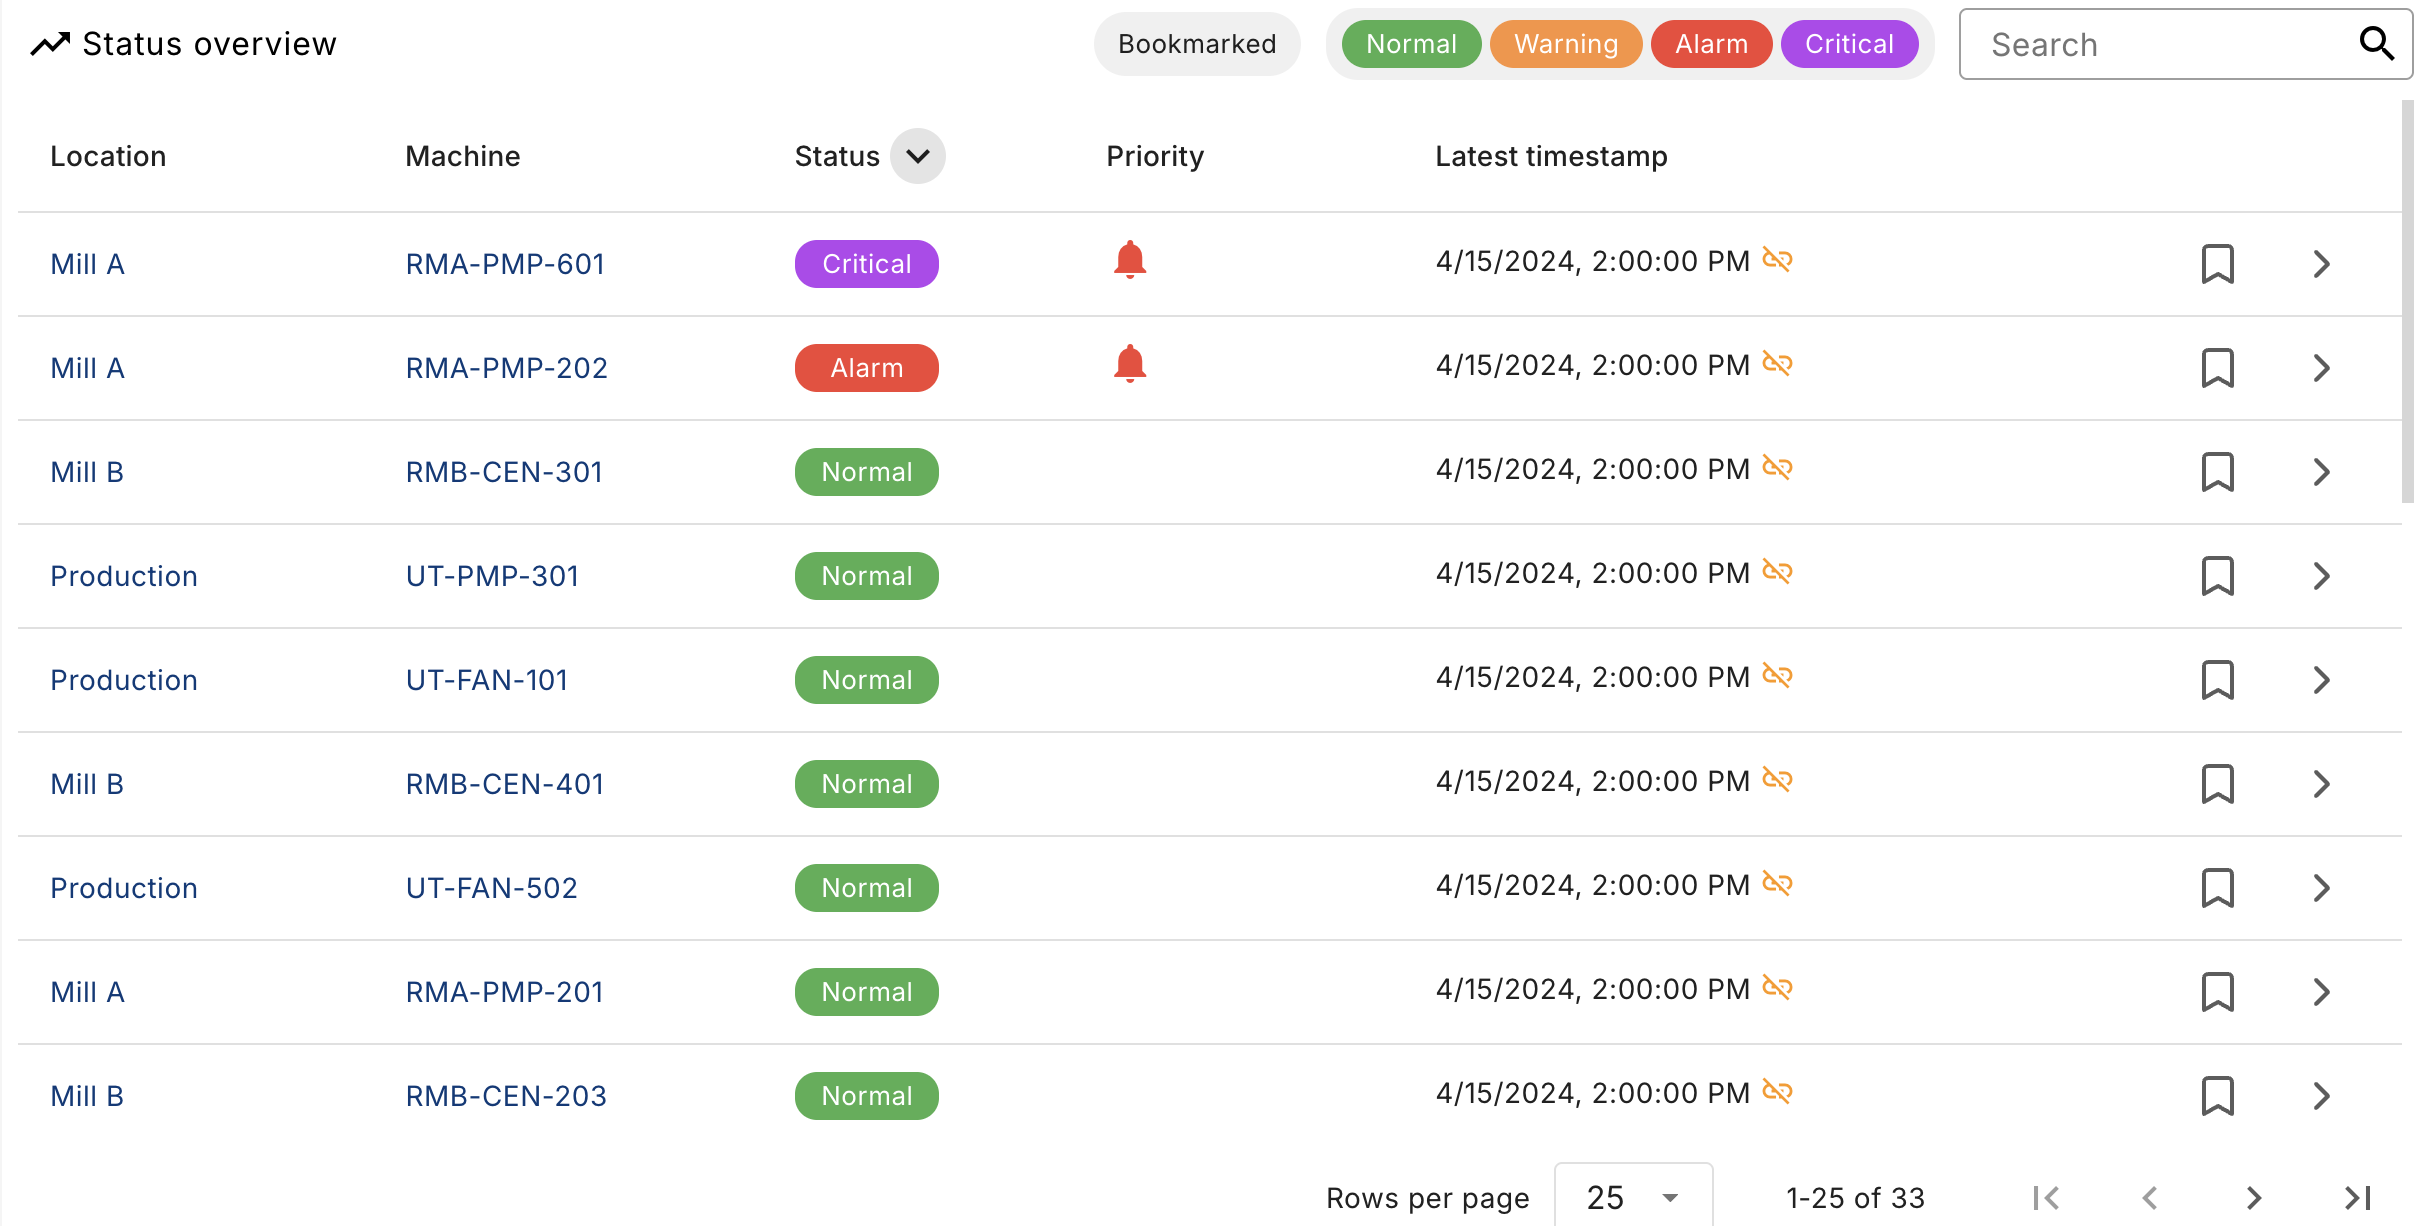
3. Inherited Machine Status
On the Overview page, machine status now automatically inherits the highest-priority status from its connected sensors. If a single sensor reports a high-priority condition, the machine status will reflect it immediately.
Before:

After:
4. Acceleration RMS “Jump Detector”
We’ve introduced automated, threshold-less detection of sudden increases in acceleration RMS. This allows the system to identify RMS jumps faster and notify you earlier when critical changes occur.

5. Performance & Stability
Includes various bug fixes and speed improvements to enhance overall system performance.