
Deep Analysis in MultiViz: Trend Plot, Measurement Widget and FFT Widget
Introduction
The Deep Analysis page in MultiViz is the core area where vibration experts delve deep into the data for comprehensive examination. This page is designed to facilitate a detailed analysis of machine measurements, offering a range of tools and functionalities for in-depth evaluation. Experts can explore various data points, compare historical trends, and apply advanced analytical techniques to diagnose potential issues effectively.
The analysis page consists of three widgets:
- Vibration Metric Widget
- Measurement Widget
- FFT Widget

How to reach the Deep Analysis View page
The page can be reached from the homepage, in the following ways
- Opening the asset tree on the left of the screen to any sensor level
- Clicking on any machine > clicking on any sensor
Vibration Metric Widget (or Trend Plot)
The core feature of the Deep Analysis page is the Vibration Metric Widget (or Trend Plot), which provides a visual overview of how vibration metrics change over time. This widget supports trend analysis, mode identification, and anomaly detection through intuitive features like smoothing, filtering, and zooming. By visualizing this data interactively, users can pinpoint emerging issues and correlate events with machine conditions more effectively.
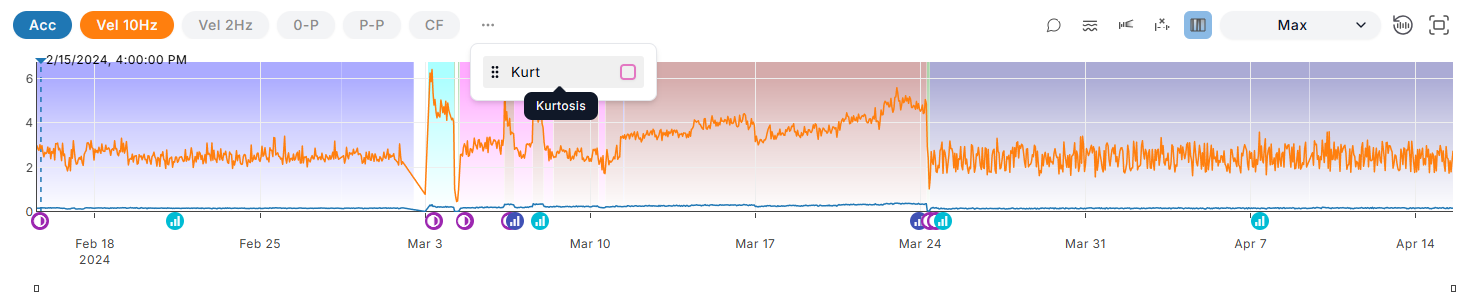
Trends
- The Trends can be chosen from the buttons over the plot. If any is missing, find it in the three-dotted menu.
- To better see trends in the data, various levels of smoothing can be applied via the slider in the top middle.
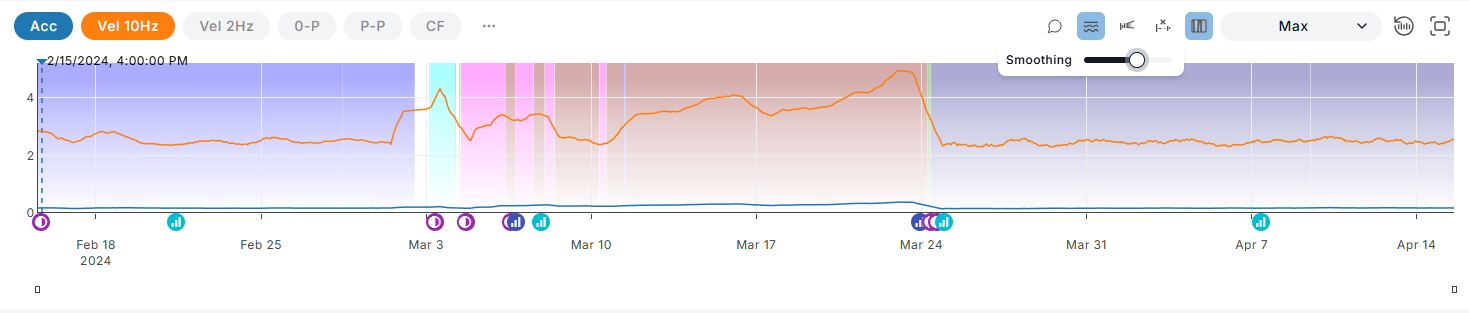
To change the visible time window, you can either zoom in by marking a section of the plot or use the buttons in the bottom left corner.
Modes
Modes are another core feature of Multiviz. They are groups of measurements that share similar characteristics, particularly in how their spectra look in terms of peaks and energy distribution. This grouping enables you to gain a clear understanding of a machine's condition by examining just a few examples.
Each background color identifies a different mode. Modes are by default visible, but can be toggled off using the Hide Modes filter.
Off Modes
Off modes are the absence of modes (this can happen when your machine is inactive or sensors are not sending data). They are automatically detected and plotted in gray. You can filter them out by clicking the “Hide Off Measurements” button.
Anomalies
Some measurements may not be assigned to any modes by the ModeId algorithm. These anomalies are plotted in white.
Events
Events in MultiViz are represented by small icons that appear in the dashboard to highlight specific signal behaviors detected in your machine data. Each event type signals something different—from emerging anomalies to specific patterns like modulation or high-frequency changes.
All events appear below the Vibration Metric Widget, each type represented by a distinct symbol. You can filter out events to declutter the view and make it easier to identify other events using the event filters. For example, in the image below, we filtered out everything but High Frequency, which is still visible below the X-axis of the plot.
Hover over an event to view additional details.
Left-click an event to select its measurement. Use Ctrl + click to select multiple measurements. (more on this in the FFT Widget)
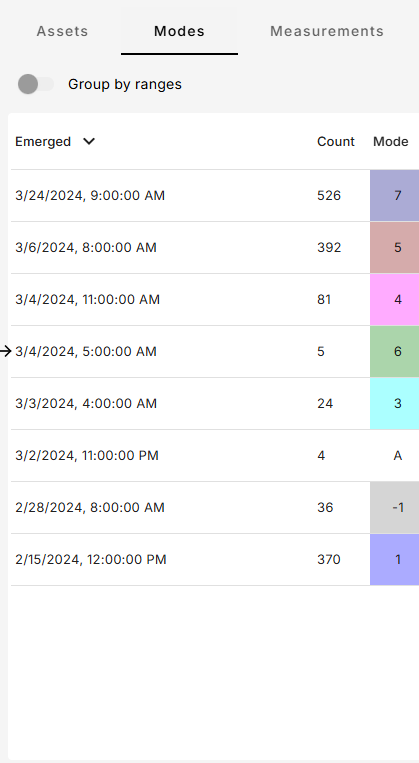
Measurement Widget
The Measurement Widget enables you to select a specific timestamp. Each measurement includes a mode value assigned by the ModeId algorithm.
The Modes section displays:
- Number of measurements assigned to each mode
- The emerging mode timestamp (i.e., first appearance of a mode)
The Assets tab mirrors the asset prioritization view for quick navigation.
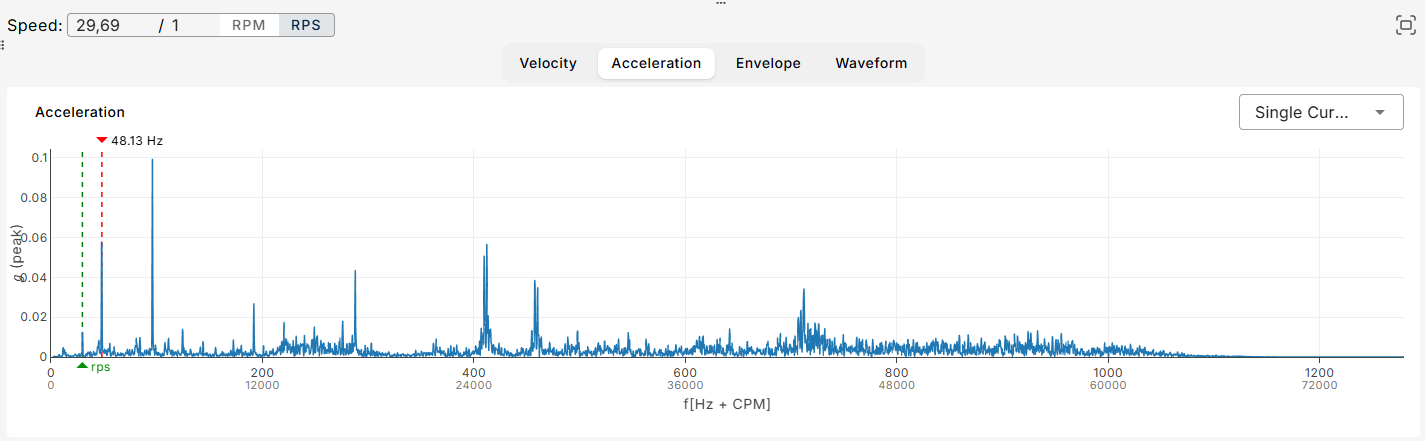
FFT Widget
The FFT Widget enables experts to inspect Velocity, Acceleration, Envelope, and Waveform for one or more measurements.
Cursors
You can choose between 3 types of cursors, in the top right button (Single Cursor, Harmonics and Sidebands)
Single Cursor
The default cursor is single cursor
Harmonics
You can input the machine's RPM in the top-right field and switch in the top right button to "Harmonics" for Harmonic Analysis.

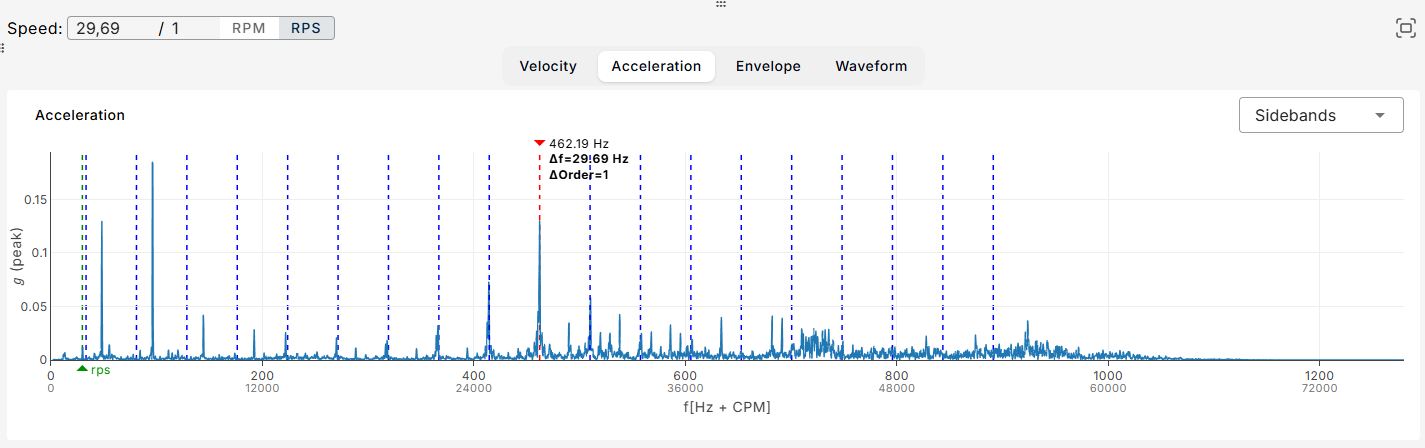
Sidebands
Choose sidebands, select a central frequency, then align the first band with a peak. The remaining bands adjust automatically. Delta values (Hz and orders) are calculated based on the speed provided.
Plots
You can choose between 4 types of plots with the buttons above (Velocity, Acceleration, Envelope and Waveform).
Waveform Plot
To measure time deltas in the waveform:
- Left-click one point in the signal
- Left-click a second point
- The time delta and frequency will be calculated automatically.
You can also listen to the waveform by clicking the speaker icon.
Envelope Plot
The envelope of the waveform is calculated and then transformed via FFT. Frequency range is limited to 500 Hz – 10,000 Hz or ½ the sampling rate (whichever is lower). The envelope is especially useful for detecting bearing faults.
Clearing Priority Alerts
The Clear button in the top left, next to the sensor name, allows you to clear priority alerts directly from the Deep Analysis View.
The “Highlights” icon: Symptoms & Changes
The “Highlights” icon on the top right corner gives you access to Symptoms and Changes.
The Deep Analysis page in MultiViz empowers vibration experts with a rich, interactive environment to investigate machine health at a granular level. With powerful tools like the Vibration Metric, Measurement, and FFT Widgets, users can uncover trends, identify anomalies, and correlate events with machine behavior. From mode classification to harmonic and envelope analysis, this page is designed to support precise diagnostics and confident decision-making, ultimately enhancing reliability and reducing downtime.