
Symptoms and Changes: How We Read Between the Lines
Understanding Symptoms
Symptoms are your best tool to interpret data in the Viking Analytics Dashboard.
Symptoms appear in the Deep Analysis View. You can select one at the time and see their occurance over time as well as some hand picked examples. They’re designed to help you go from detection to diagnosis faster, by highlighting recurring signal patterns that could indicate specific mechanical or electrical issues.
What Is a Symptom?
A symptom is a specific pattern in the vibration signal — like modulation, harmonics, or dominant frequency peaks — that can act as a fingerprint for a possible fault. Multiviz identifies and classifies these patterns in real time, and associates them with potential causes.
This allows you to:
- See beyond simple threshold alerts
- Catch early warning signs before a fault becomes critical
- Understand why the system raised an alert
Where to find Symptoms in the tool?
In the Deep Analysis View, you reach the symptoms by clicking the “Highlights” icon in the top right.
The symptoms are of two types, active (colored) and inactive (black and white). The active ones are where you should focus your attention, but we keep all detections for future reference. This makes it easy to understand what’s happening without needing to dig through the raw data. Each symptom is automatically identified and linked to relevant parts of the signal, helping you quickly assess the situation.
The 11 Symptoms Detected by Multiviz
Below are the 11 distinct signal-based symptoms Multiviz can identify, along with what they mean and what types of faults they typically point to:
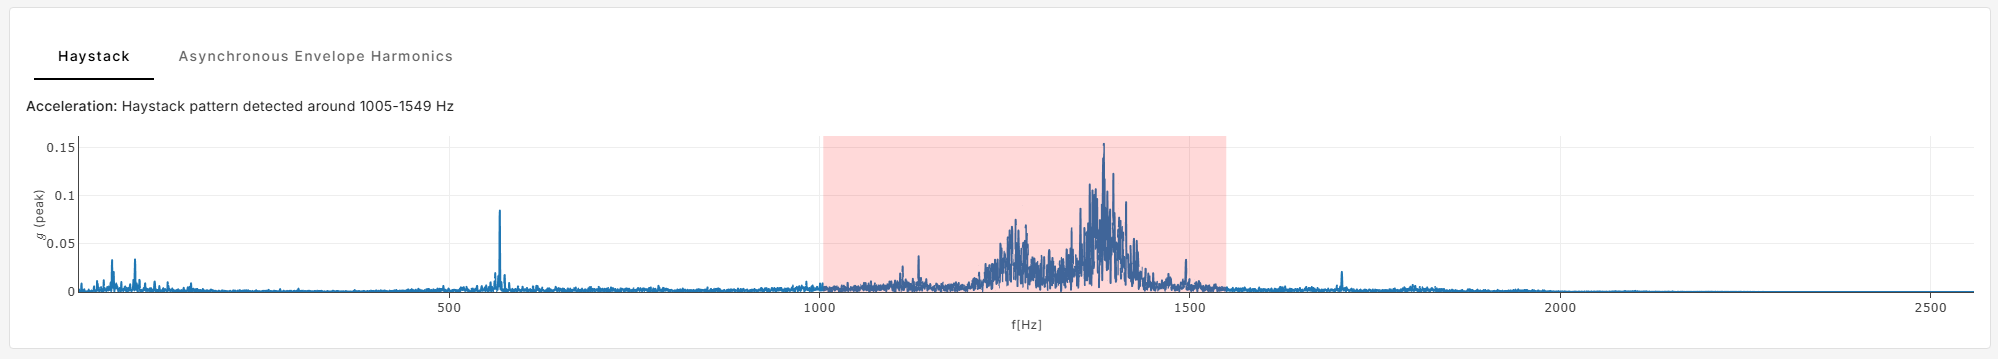
Haystack
Explanation: Raised noise floor in the higher frequencies of the acceleration signal.
Possible faults: Lubrication issues
How it looks like:
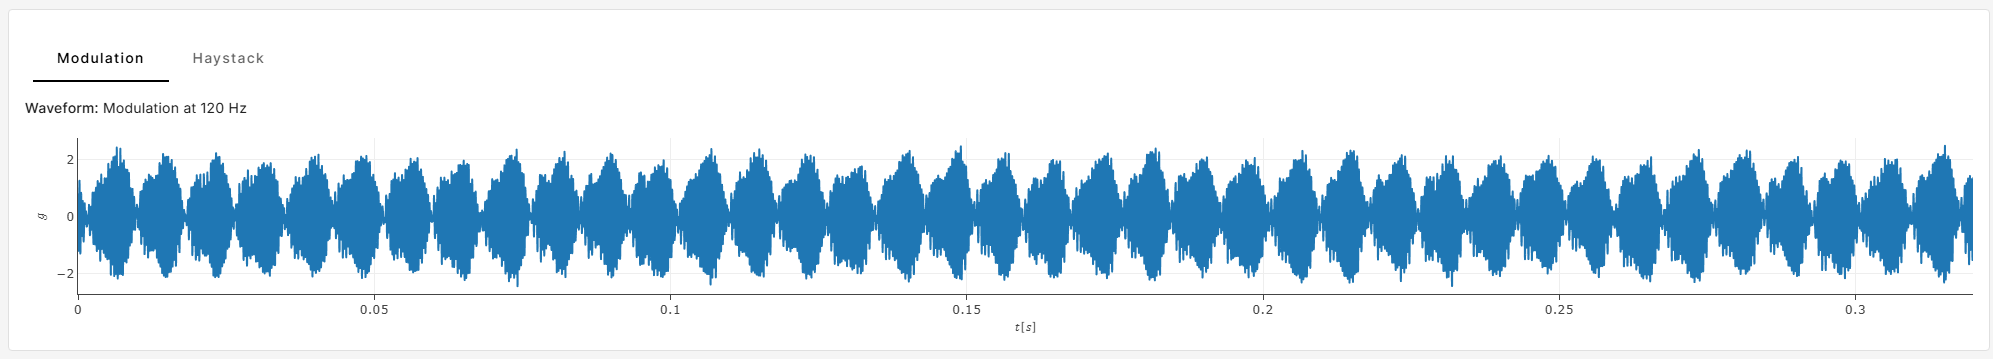
Modulation
Explanation: Periodic modulation of the waveform.
Possible faults: Beating (interaction between two close frequencies)
How it looks like:
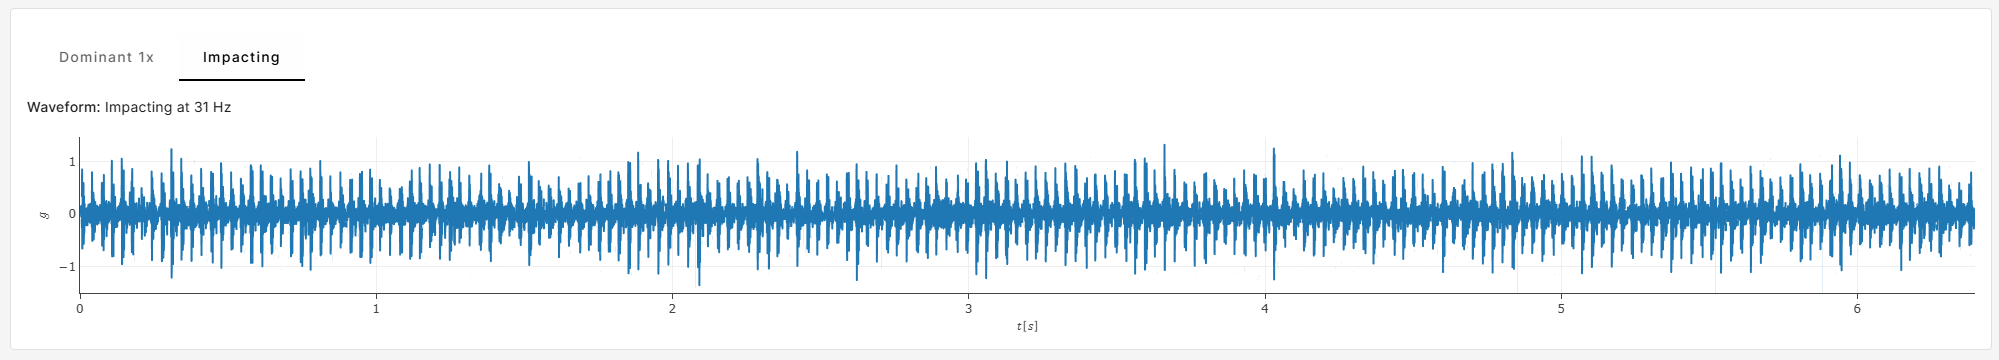
Impacting
Explanation: Repeated impulsive hits appear in the waveform.
Possible faults: Bearing damage
How it looks like:
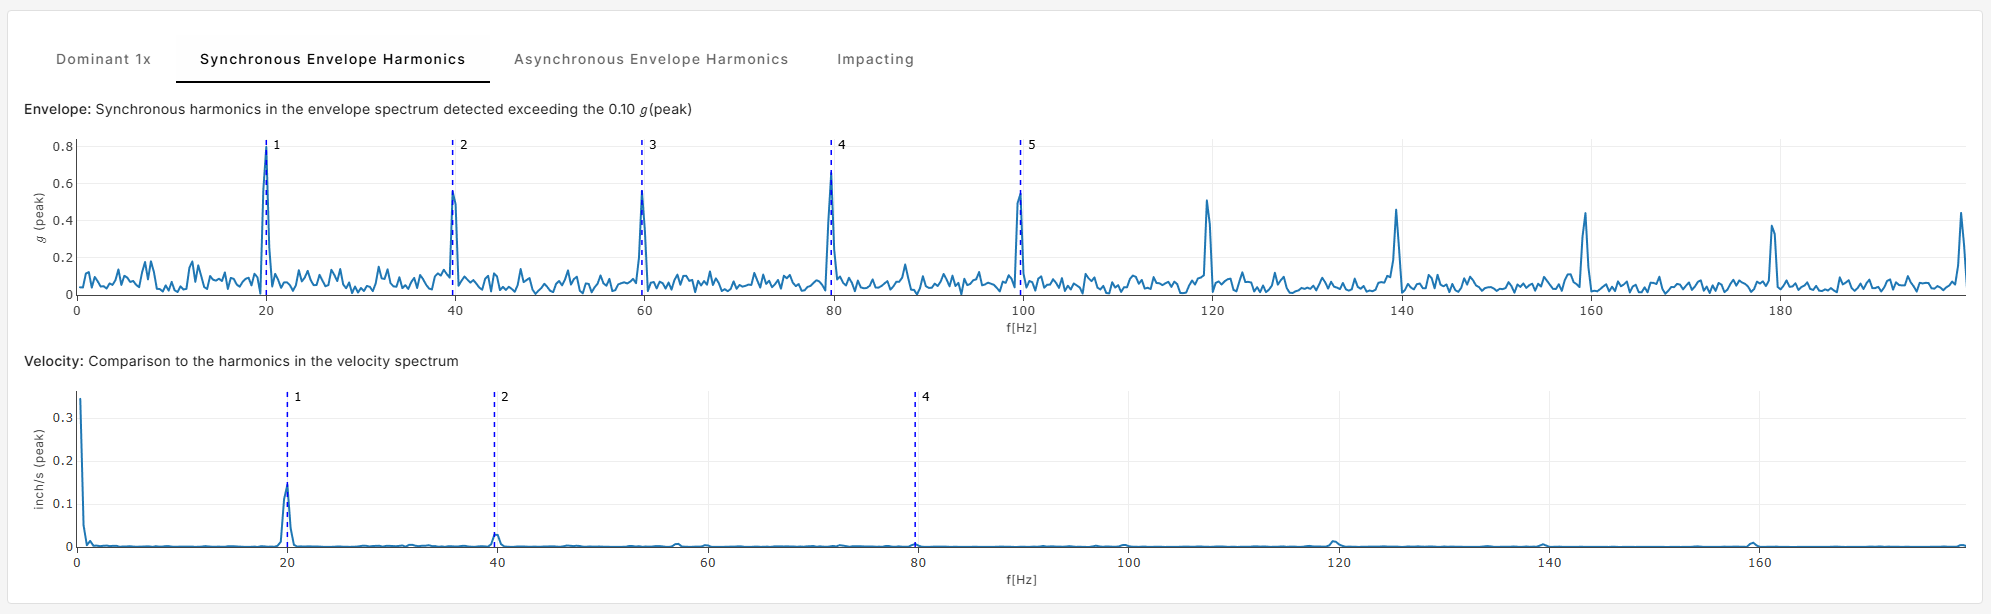
Synchronous Envelope Harmonics
Explanation: Harmonics in the envelope spectrum where the fundamental is an integer multiple of RPM.
Possible faults: Rotating looseness
How it looks like:
Sub-Synchronous Envelope Harmonics
Explanation: Harmonics in the envelope spectrum where the fundamental is below the RPM.
Possible faults: Bearing cage defects
How it looks like:

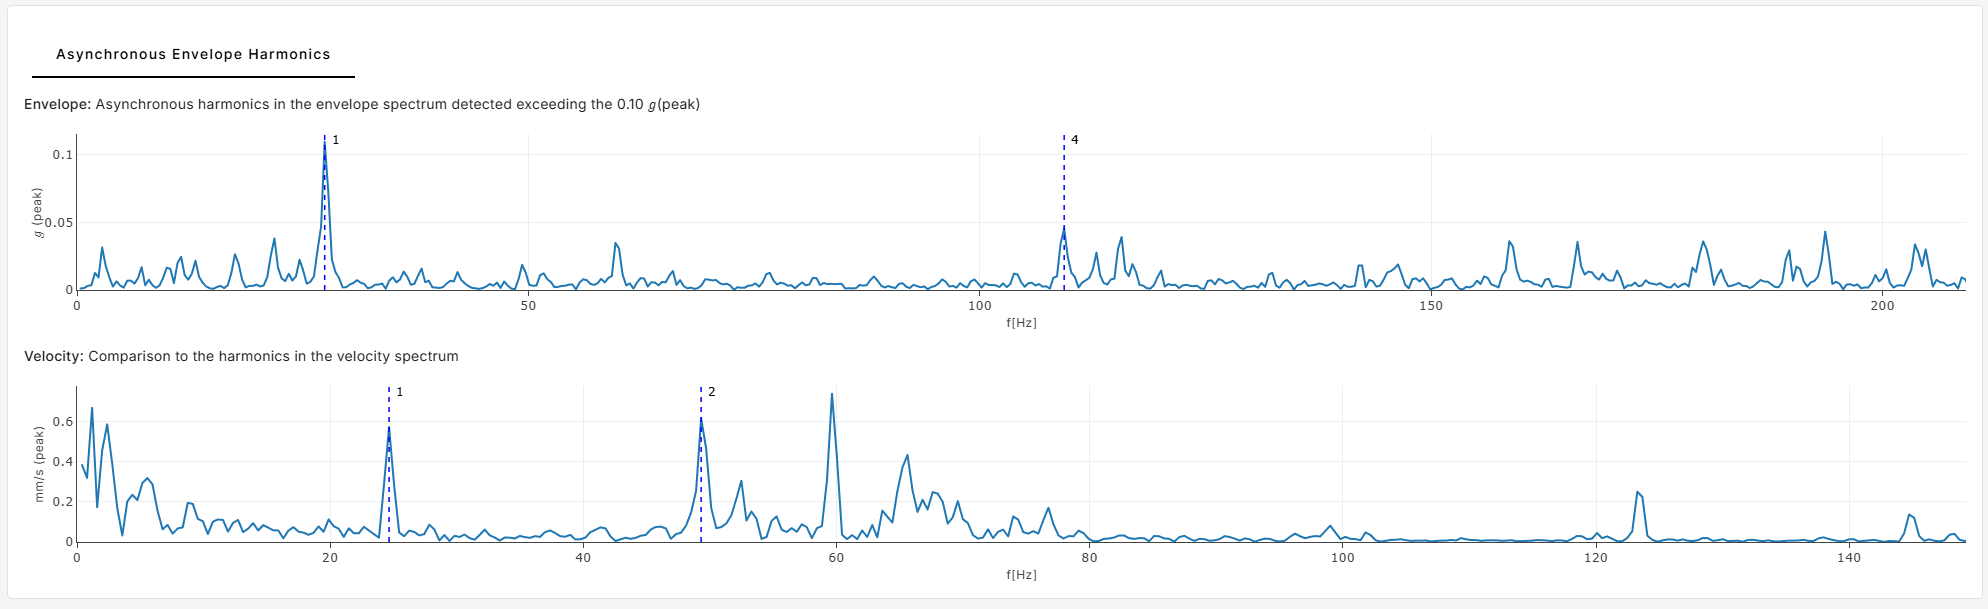
Asynchronous Envelope Harmonics
Explanation: Harmonics in the envelope spectrum higher than RPM but not integer multiples. Also used when harmonics are found in the envelope but not in velocity.
Possible faults: Inner/outer race bearing damage
How it looks like:
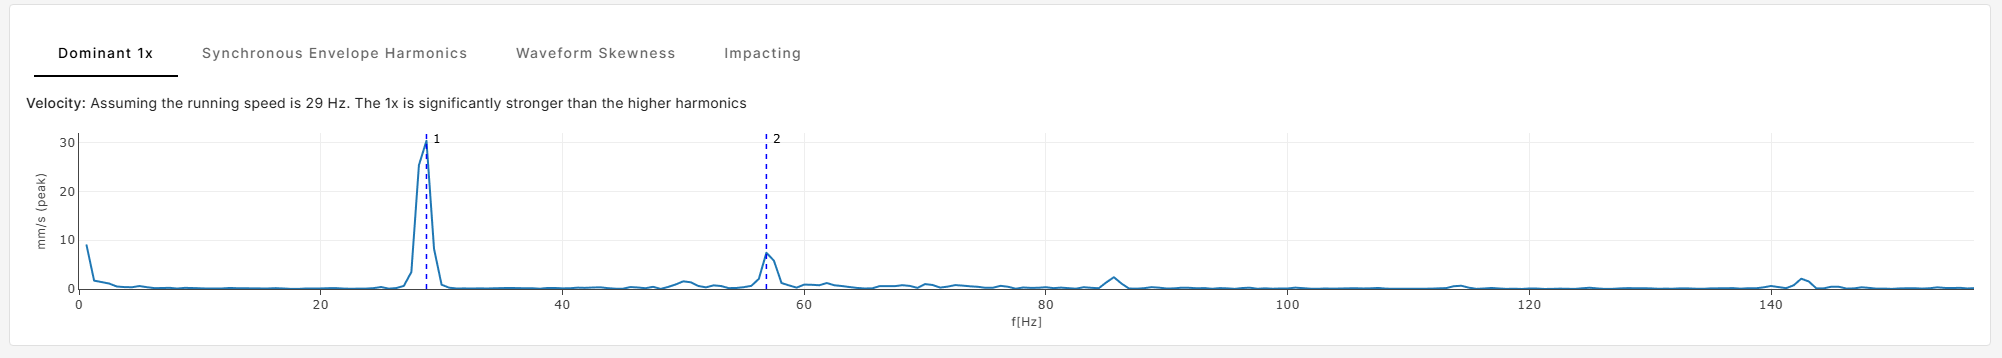
Dominant 1X
Explanation: The fundamental frequency (1x RPM) is significantly stronger than its harmonics.
Possible faults: Unbalance, eccentricity, bent shaft
How it looks like:
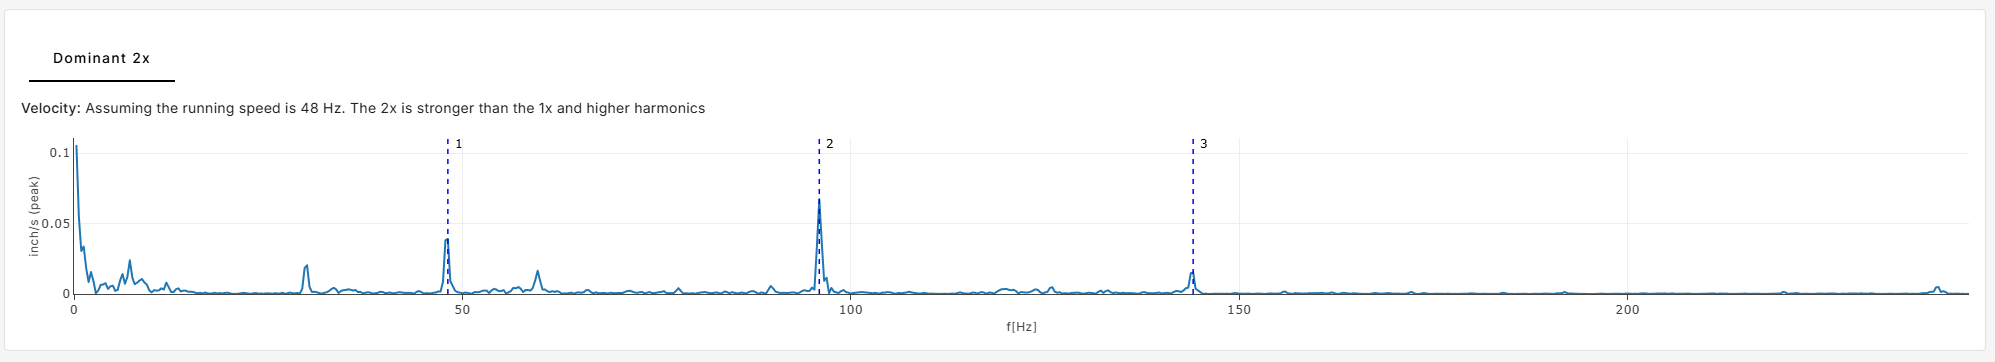
Dominant 2X
Explanation: The second harmonic (2x RPM) is dominant in the signal.
Possible faults: Misalignment, bent shaft, looseness
How it looks like:
Dominant Higher X
Explanation: Harmonics 3x–5x RPM dominate the signal.
Possible faults: Cocked bearing, misalignment, looseness
How it looks like:

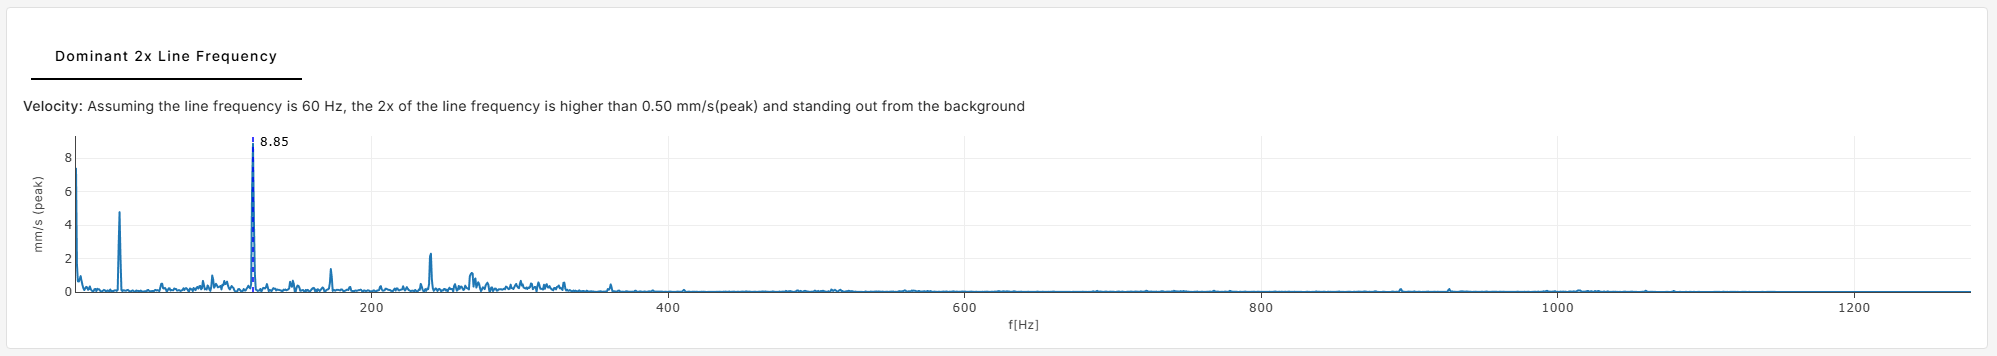
Dominant 2X Line Frequency
Explanation: Strong 2x line frequency component, relative to the rest of the spectrum.
Possible faults: Electrical issues — e.g., soft foot, short circuit, stator eccentricity, rotor bar problems
How it looks like:
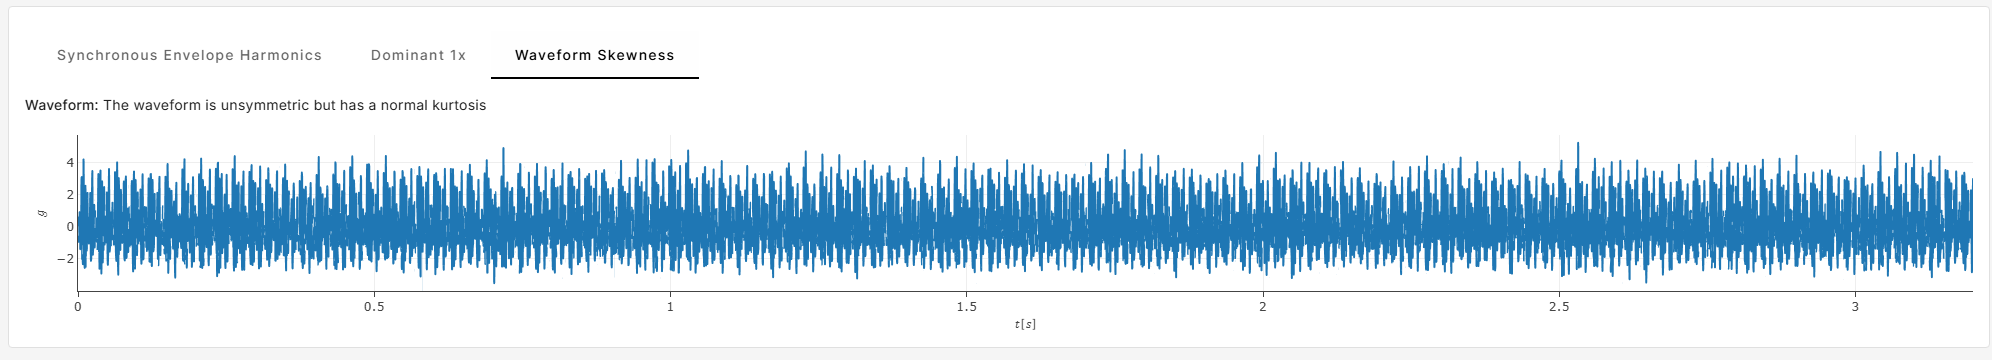
Waveform Skewness
Explanation: Asymmetry in the waveform without high kurtosis.
Possible faults: Structural looseness
How it looks like:
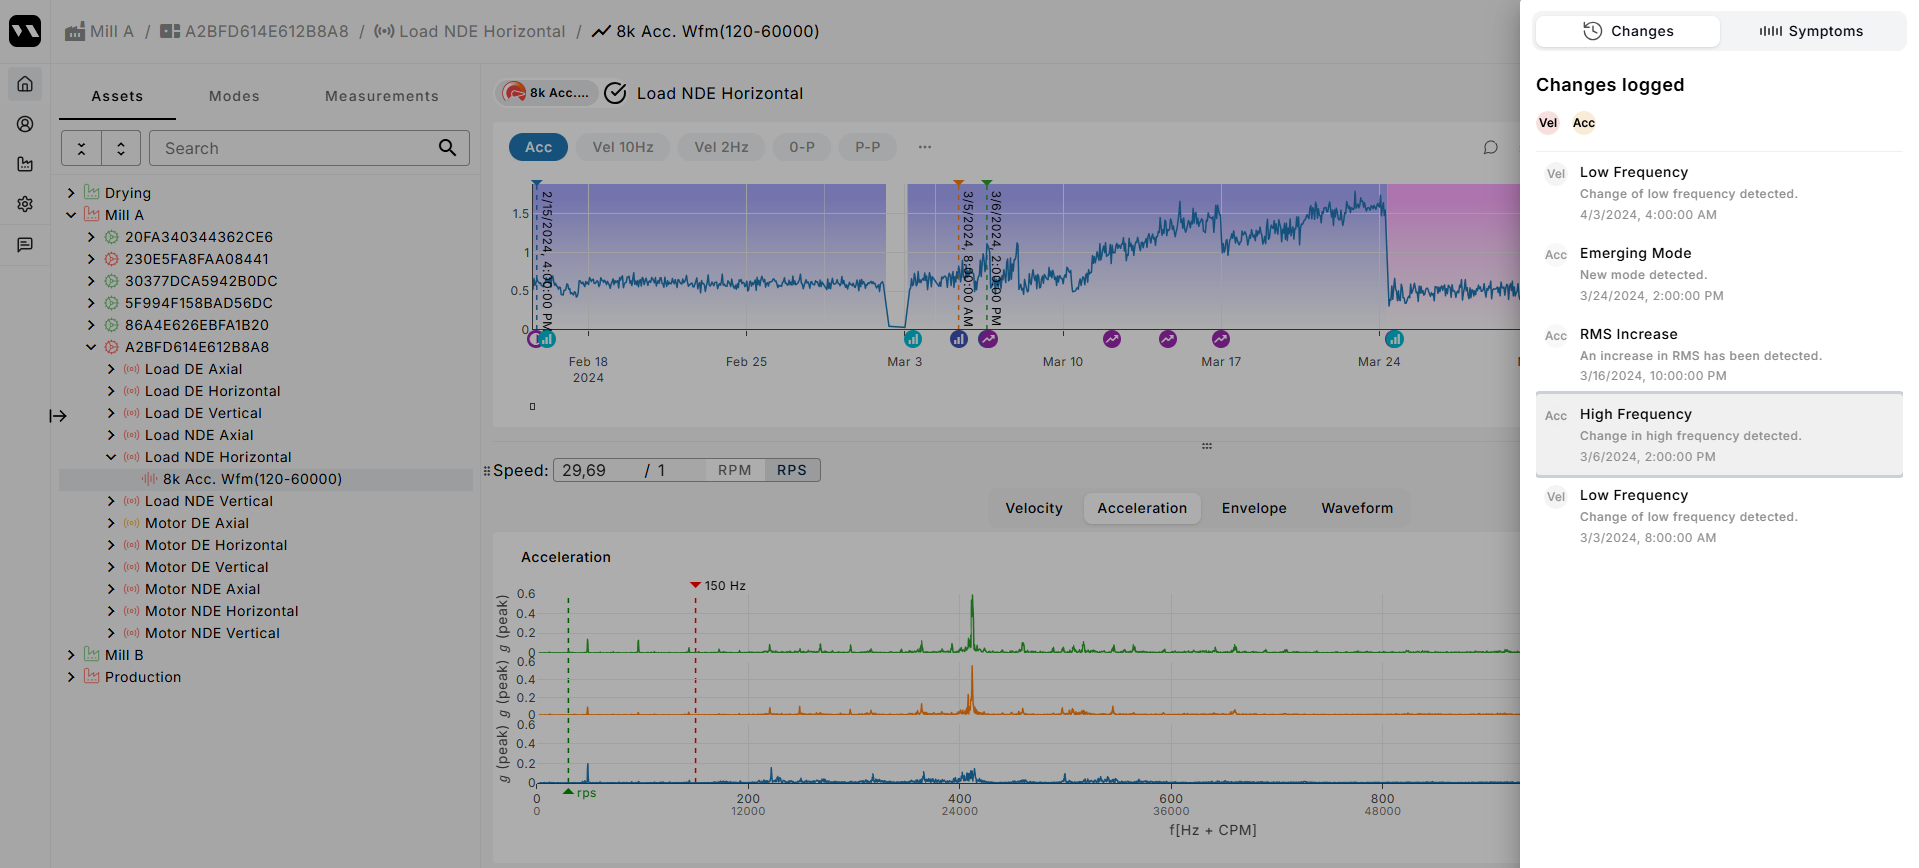
Changes
The Changes tab (next to the Symptoms tab), shows all the changes that happened at the sensor levels. This includes new symptoms and modes.
If you select one, you'll see the relative measurements spectrum. Changes too are divided into active and inactive. Active changes have happened recently and inactive changes are kept as a reference for the future.
Summary
Symptoms and changes give you a fast, transparent way to understand what triggered an alert and what it might mean, without needing to be a signal processing expert.
They bring you:
- Machine-readable context
- Suggested fault types
- A jump-start to deeper investigation
The result? Less guesswork, more clarity, and faster decisions.