
February Improvements Roundup
February brings a set of improvements focused on visibility, analysis precision, and easier navigation across the platform.
1. Sites Overview
A new unified page now displays the health status of all sites. Sites are organized by company, providing a clear overview and allowing you to quickly open any specific site for deeper analysis.
2. Envelope Filters
Preset and customizable envelope filters are now available for signal analysis. Applying these filters isolates specific frequency bands, improving the accuracy of fault detection.
3. New KPIs
Two new Key Performance Indicators are now actively tracked within the platform:
- Envelope Peak Score
A weighted sum of prominent peaks, designed to detect impacts and help assess their severity. - Envelope RMS
Provides a clear measurement of the overall energy in the envelope signal.
4. FFT Plot Timestamps
Timestamps now appear directly on FFT plots for both single and multiple measurements and are preserved when downloading the plot as an image.
You can also interactively toggle them:
- Click once to hide the timestamp
- Click twice to isolate and display only the timestamp
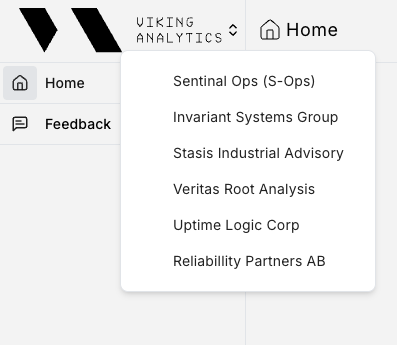
5. Tenant Switch
Users with multi-tenant access can now switch between workspaces using a dropdown menu located next to the top-right logo, making navigation between environments faster and more seamless.
6. Integrations Page
The integrations page has been redesigned with a clearer, structured layout. Connectivity options are now organized into three categories:
- Direct integrations: Ready for immediate use
- Assisted integrations: Available with guided setup support
- Upcoming integrations: Currently in development
If there is a specific integration you need, feedback is always welcome. Reach out to support.
7. Priority Alert Timestamps
The machine list now includes a “Last Priority Update” column. This shows the exact time a machine’s priority status last changed, helping you quickly identify and focus on the most recent events.